Contents lists available at ScienceDirect journal homepage: www.elsevier.com/locate/envexpbot
Flavia V.P. Reis, María J. Gutiérrez-Ginés*, Carol M.S. Smith, Niklas J. Lehto, Brett H. Robinson
Dept. of Soil and Physical Sciences, Faculty of Agriculture and Life Sciences, Lincoln University, PO Box 85084, Lincoln 7647, New Zealand
1Introduction引言
Countries with sewage treatment plants produce ca. 27 kg (dry matter) of biosolids per person per year, with global production exceeding 10 million tons per year (Bradley, 2008). Although land application of biosolids is commonplace (Lu et al., 2012; Singh and Agrawal, 2008) due to their potential as fertilizers and soil conditioners (Salazar et al., 2012; Speir et al., 2004; Tian et al., 2013), only 30% of the biosolids produced in New Zealand are applied to land (ANZBP, 2016). This figure stands in contrast to New Zealand’s strategy that requires 95% of biosolids to be beneficially reused. The reuse of biosolids could reduce the reliance on inorganic fertilizers such as superphosphate, which have been associated with elevated soil concentrations of Cd, F, (Loganathan et al., 2003) Pb and As (Jiao et al., 2012).
拥有污水处理厂的国家每人每年产生约27 kg(干物质)生物固体(污泥),全球年产量超过1000万吨(Bradley, 2008)。由于生物固体具有作为肥料和土壤调理剂的潜力(Salazar et al., 2012; Speir et al., 2004; Tian et al., 2013),其土地施用已十分普遍(Lu et al., 2012; Singh and Agrawal, 2008),但新西兰所产生的生物固体仅有30%施用于土地(ANZBP, 2016)。这一数字与新西兰要求95%的生物固体得到有益再利用的战略形成鲜明对比。生物固体的再利用可减少对过磷酸钙等无机肥料的依赖,而此类肥料与土壤中Cd、F(Loganathan et al., 2003)、Pb和As(Jiao et al., 2012)浓度升高有关。
* Corresponding author.
E-mail address: mariajesus.gutierrez@lincoln.ac.nz (M.J. Gutiérrez-Ginés).
In New Zealand, just 5.5% of the country’s soils have sufficient natural fertility and value for food production (Hewitt, 2010). The remaining low-fertility soils require heavy fertilisation or lownutrient demanding land uses such as forestry or extensive grazing. Historically, pine plantations have received biosolids to accelerate tree growth and improve the nutritional status of the soil and trees without negatively affecting the soil microbial communities or adding unacceptable amounts of trace elements to the soil or trees (Wang et al., 2013, 2004; Xue et al., 2015). However, due to the falling price of pine timber, there is little incentive to replant these low fertility soils in pine forests. Alternatively, these lands could be returned to native vegetation that generates valuable natural products (NZTE, 2016), which could provide environmental and social benefits (Roberts et al., 2015).
在新西兰,仅有5.5%的土壤具有足够的自然肥力和粮食生产价值(Hewitt, 2010)。其余低肥力土壤需要大量施肥,或只能用于林业、粗放放牧等低养分需求的土地利用方式。历史上,辐射松人工林曾施用生物固体以加速树木生长、改善土壤和树木的营养状况,且不会对土壤微生物群落产生负面影响,也不会向土壤或树木中添加不可接受量的微量元素(Wang et al., 2013, 2004; Xue et al., 2015)。然而,由于松木价格下跌,在这些低肥力土壤上重新种植松林的动力不足。作为替代,这些土地可恢复为能够产生高价值天然产品的本土植被(NZTE, 2016),从而带来环境和社会效益(Roberts et al., 2015)。
Manuka (Leptospermum scoparium J.R.Forst. & G.Forst.) is a strong candidate for planting in marginal lands. Of all the native species in New Zealand, L. scoparium has the greatest economic potential with honey and essential oil production being highly profitable. However, since this species is mostly found in low-fertility and poorly drained environments (Stephens et al., 2005), it is unclear whether amending poor soils with nutrient-rich biosolids will be beneficial for its growth.
麦卢卡(Leptospermum scoparium J.R.Forst. & G.Forst.)是边际土地种植的有力候选物种。在新西兰所有本土物种中,L. scoparium的经济潜力最大,其蜂蜜和精油生产利润丰厚。然而,由于该物种主要分布于低肥力和排水不良的环境中(Stephens et al., 2005),目前尚不清楚用富含养分的生物固体(污泥)改良贫瘠土壤是否有利于其生长。
http://dx.doi.org/10.1016/j.envexpbot.2016.10.012 0098-8472/ã 2016 Elsevier B.V. All rights reserved.
http://dx.doi.org/10.1016/j.envexpbot.2016.10.012 0098-8472/© 2016 Elsevier B.V. 版权所有。
There are various options for the application of biosolids to low-fertility soils with the goal of enhancing L. scoparium production including ploughing, surface application, or strip-tilling. Each of these methods has distinct advantages and disadvantages, dependent on the soil environment. The method of biosolids application can affect not only the efficacy of biosolids as a fertilizer and soil conditioner, but also the soil properties and processes due to tillage activities (Alvarez and Steinbach, 2009). Many reports detail the efficacy of the incorporation or surfaceapplication of biosolids. However, these studies are usually based on plant growth, yield, and the fate of nutrients or contaminants (Barbarick et al., 2012; Castillo et al., 2011). No studies have investigated the response of plant roots to the heterogeneous soil environment that biosolids application generates.
为提高L. scoparium产量,在低肥力土壤上施用生物固体(污泥)有多种方式,包括翻耕、表面施用或条带耕作。每种方法都有其独特的优缺点,取决于土壤环境。生物固体的施用方式不仅会影响其作为肥料和土壤调理剂的效果,还会因耕作活动而影响土壤性质和过程(Alvarez and Steinbach, 2009)。许多报道详细描述了生物固体混入或表面施用的效果,但这些研究通常基于植物生长、产量以及养分或污染物的归趋(Barbarick et al., 2012; Castillo et al., 2011)。尚无研究探讨植物根系对生物固体施用所形成的异质土壤环境的响应。
Many plant species can respond to heterogeneous distribution of nutrients by increasing the nutrient uptake capacity and/or by proliferating the roots in patches with higher nutrient concentration (Hodge, 2004). However, there is a wide range of factors that affect these responses, including the type of nutrient present in the patch, the concentration of nutrients in the patch in relation with the soil background, the distribution and size of patches, and the plant species (ecological strategy of the plant). Trace elements or other contaminants in soils can also induce variations in root architecture (Arduini et al., 1994).
许多植物物种能够通过提高养分吸收能力和/或在养分浓度较高的斑块中增殖根系,来响应养分的异质分布(Hodge, 2004)。然而,影响这些响应的因素很多,包括斑块中养分的类型、斑块中养分浓度与土壤背景的相对关系、斑块的分布和大小以及植物物种(植物的生态策略)。土壤中的微量元素或其他污染物也可引起根系构型的变化(Arduini et al., 1994)。
We aimed to determine the growth and the elemental composition of L. scoparium in two soils amended with biosolids either homogeneously or heterogeneously. We also sought to elucidate the behaviour of L. scoparium roots to contrasting distributions of biosolids in soil.
本研究旨在测定L. scoparium在以均匀或非均匀方式施用生物固体(污泥)改良的两种土壤中的生长和元素组成,并阐明L. scoparium根系对土壤中生物固体不同分布方式的响应行为。
2Materials and methods材料与方法
2.1. Collection and preparation of soils, biosolids and plants2.1. 土壤、生物固体和植物的采集与制备
Soils (ca. 100 kg each) were collected from two degraded areas that could potentially receive biosolids for reforestation with L. scoparium. The first soil, S1 (Sandy Raw soil, Hewitt, (2010)), was a sand from an area of old dunes 5 km north of Kaikoura, Canterbury, New Zealand (42�21037.700S 173�41028.100E). The second soil, S2, (Orthic Brown Soil, Hewitt, (2010)) was sourced from the top 40 cm of a Pinus radiata plantation in Eyrewell forest, 26 km south east of Oxford, Canterbury (43�43087.1100, 172�45030.7900). Both soils were collected by removing any surface vegetation and sampling from the top 40 cm, as this represent the depth to which biosolids are incorporated during land application. The soils were homogenised and passed through a 20 mm sieve to remove stones while maintaining soil aggregates and structure. Subsamples of both soils were taken for chemical analyses (Table 1).
从两个可能接受生物固体(污泥)用于L. scoparium植被恢复的退化区域分别采集土壤(各约100 kg)。第一种土壤S1(砂质原始土,Hewitt, (2010))为砂土,采自新西兰坎特伯雷Kaikoura以北5 km的古沙丘区(42°21′37.7″S 173°41′28.1″E)。第二种土壤S2(正常棕色土,Hewitt, (2010))采自坎特伯雷Oxford东南26 km处Eyrewell林区辐射松(Pinus radiata)人工林的表层40 cm(43°43′87.11″, 172°45′30.79″)。两种土壤均在清除地表植被后采集表层40 cm,因为这代表土地施用时生物固体混入的深度。土壤经均匀化后过20 mm筛以去除石块,同时保持土壤团聚体和结构。取两种土壤的子样品进行化学分析(表1)。
Biosolids were collected from a stockpile at the Kaikoura Regional treatment works, at Kaikoura, Canterbury. Before being stored in the stockpile, the biosolids went through initial treatment of sedimentation and anaerobic digestion in settlement ponds. The biosolids were collected from eight different locations across the pile and bulked. The biosolids were homogenised and passed through a 20 mm sieve. Subsamples were taken from the sieved bulk sample and further processed for subsequent chemical analysis (Table 1).
生物固体(污泥)采自坎特伯雷Kaikoura的Kaikoura区域污水处理厂的堆放场。在堆放之前,生物固体在沉淀池中经过了沉降和厌氧消化的初步处理。从堆体的八个不同位置采集生物固体并混合,经均匀化后过20 mm筛。从过筛后的混合样品中取子样品,进一步处理后用于后续化学分析(表1)。
Approximately 100 L. scoparium seedlings were obtained in seedling trays from Wai-Ora nursery (Christchurch, New Zealand, http://www.waioralandscapes.co.nz). Seedlings ranged in above ground size from 4 cm to 6.5 cm when planted. The seedlings chosen for the trials had small roots, where the main root was of similar size to the above ground plant and had few laterals. Before planting, the roots were carefully washed with tap water to remove the potting mix.
从Wai-Ora苗圃(新西兰基督城,http://www.waioralandscapes.co.nz)获得约100株育苗盘培育的L. scoparium幼苗。种植时幼苗地上部分高度为4 cm至6.5 cm。试验所选幼苗根系较小,主根长度与地上部分相近,侧根较少。种植前用自来水小心冲洗根系以去除育苗基质。
Mean and standard deviation (n = 5) of the parameters determined in soils, biosolids and mixtures used in the pot experiment. Units are mg kg�1 unless otherwise indicated. T, pseudototal concentration; E, extractable concentration.
盆栽试验所用土壤、生物固体及其混合物各参数的平均值和标准差(n = 5)。除另有说明外,单位为mg kg−1。T,准全量浓度;E,可提取态浓度。
| Parameter参数 | Soil 1土壤1 | Soil 2土壤2 | Biosolids生物固体 | Soil 1 + biosolids土壤1 + 生物固体 | Soil 2 + biosolids土壤2 + 生物固体 | |
|---|---|---|---|---|---|---|
| pH | 8.8 � 0.1 | 4.9 � 0.0 | 4.3 � 0.0 | 5.2 � 0.1 | 4.3 � 0.0 | |
| EC | (mS cm�1) | 24 � 1.3 | 97 � 3.2 | 2634 � 52 | 282 � 25 | 397 � 21 |
| C | (%) | 0.13 � 0.03 | 3.9 � 0.2 | 23 � 1.5 | 0.33 � 0.03 | 4.9 � 0.32 |
| N | (%) | < 0.05 | 0.20 � 0.01 | 2.3 � 0.1 | 0.11 � 0.02 | 0.97 � 0.24 |
| NH4 + �N | 0.0 � 0.0 | 3.1 � 0.5 | 504 � 25 | 17 � 4.7 | 18 � 2.5 | |
| NO3 ��N | 0.0 � 0.0 | 23.3 � 3.4 | 634 � 57 | 35 � 7.6 | 87 � 26 | |
| S | T | 110 � 13 | 210 � 3.7 | 9010 � 200 | 550 � 47 | 830 � 102 |
| E | 32 � 50 | 32 � 51 | 1500 � 200 | 150 � 20 | 180 � 16 | |
| P | T | 480 � 36 | 370 � 6.9 | 5660 � 230 | 610 � 19 | 690 � 66 |
| Olsen P | 0.7 � 0.1 | 42 � 1.2 | 270 � 5.6 | 47 � 3.3 | 67 � 2.1 | |
| Ca | T | 8900 � 520 | 2700 � 84 | 11000 � 320 | 8100 � 250 | 3300 � 130 |
| K | T | 3900 � 220 | 4700 � 60 | 3800 � 50 | 4100 � 170 | 4500 � 130 |
| E | 150 � 110 | 98 � 50 | 160 � 20 | 49 � 10 | 99 � 10 | |
| Mg | T | 6400 � 170 | 4100 � 54 | 3900 � 91 | 6400 � 190 | 4400 � 99 |
| E | 120 � 12 | 140 � 40 | 230 � 13 | 82 � 13 | 160 � 13 | |
| Na | T | 240 � 12 | 220 � 4.3 | 400 � 14 | 220 � 18 | 240 � 11 |
| E | 41 � 4.3 | 25 � 7.8 | 110 � 9.1 | 29 � 4.7 | 49 � 4.9 | |
| Al | T | 17700 � 640 | 28700 � 100 | 18500 � 230 | 19200 � 960 | 32700 � 610 |
| E | 0.2 � 0.1 | 56 � 16 | 24 � 20 | 1.3 � 0.4 | 58 � 5.8 | |
| Mn | T | 430 � 11 | 340 � 15 | 250 � 7.2 | 430 � 23 | 350 � 13 |
| E | 0.3 � 0.0 | 12 � 4 | 52 � 12 | 4.6 � 0.8 | 37 � 2.8 | |
| Zn | T | 50 � 1.1 | 69 � 1.6 | 1240 � 45 | 120 � 6.5 | 170 � 13 |
| E | 0.1 � 0.1 | 0.4 � 0.2 | 280 � 54 | 20 � 4.7 | 38 � 3.9 | |
| Cu | T | 11 � 1.5 | 3.0 � 0.2 | 610 � 16 | 43 � 4.0 | 42 � 8.9 |
| E | 0.01 � 0.01 | 0.04 � 0.06 | 3.0 � 2.2 | 0.15 � 0.04 | 0.18 � 0.02 | |
| Cd | T | 0.00 � 0.00 | 0.01 � 0.01 | 2.22 � 0.14 | 0.06 � 0.03 | 0.23 � 0.10 |
| E | 0.00 � 0.00 | 0.01 � 0.01 | 0.57 � 0.35 | 0.03 � 0.01 | 0.05 � 0.01 | |
| Pb | T | 14 � 0.4 | 15 � 0.8 | 120 � 4.3 | 17 � 0.5 | 21 � 4.4 |
| E | 0.00 � 0.00 | 0.00 � 0.00 | 0.09 � 0.06 | 0.00 � 0.00 | 0.00 � 0.00 |
2.2. Pot experiment setup2.2. 盆栽试验设计
The pot experiment used 2.5 kg capacity pots and comprised three treatments on two soils, with four replicates of each treatment. Treatments were i) soil without biosolids (S1 and S2, for soils 1 and 2 respectively); ii) soil with biosolids homogeneously incorporated into the soil (+M); and iii) soil with top application of biosolids (+T). Biosolids were applied to soils at a proportion of 10% fresh weight (equivalent to 90 t/ha fresh biosolids, and to 45 t/ ha of dry biosolids). For treatment +M (homogeneous application), biosolids were mixed by hand with soil for more than 20 min, and the pots were then filled with 2.5 kg of biosolids-amended soil. The chemical properties of the soil with mixed biosolids are shown in Table 1. For treatment +T (surface application), pots were filled with 2.25 kg of soil, and 250 g of fresh biosolids were added to the soil surface, immediately after planting the L. scoparium seedlings. One L. scoparium seedling was planted in each pot.
盆栽试验采用容量为2.5 kg的花盆,在两种土壤上设置三个处理,每个处理四次重复。处理分别为:i)不施生物固体(污泥)的土壤(S1和S2,分别对应土壤1和土壤2);ii)生物固体均匀混入土壤(+M);iii)生物固体表面施用(+T)。生物固体按鲜重10%的比例施入土壤(相当于90 t/ha鲜生物固体或45 t/ ha干生物固体)。对于+M处理(均匀施用),将生物固体与土壤手工混合20 min以上,然后每盆装入2.5 kg生物固体改良土壤。混入生物固体后土壤的化学性质见表1。对于+T处理(表面施用),每盆装入2.25 kg土壤,在种植L. scoparium幼苗后立即将250 g鲜生物固体施于土壤表面。每盆种植一株L. scoparium幼苗。
The 24 pots were placed in a randomised block design in the greenhouse for 12 weeks. They were watered daily with tap water to field capacity to ensure none of the plants were water stressed. The mean temperature during the experiment period was 20.2 �C with maximum temperature of 32 �C and minimum of 9.8 �C.
24个花盆在温室中按随机区组设计摆放12周。每天用自来水浇灌至田间持水量,以确保所有植物均不受水分胁迫。试验期间平均温度为20.2 °C,最高温度32 °C,最低温度9.8 °C。
At the end of the experiment, the shoots were cut, rinsed with tap water and oven dried at 70 �C to a constant weight and weighed. Leaves were separated from stems and then weighed and sampled individually. The top 3 cm of the growing medium in the pot (consisting of soil, biosolids and root material) was cut to separate it from the remaining material in the pot below. The roots had all the soil gently brushed off and were washed in tap water before being individually sampled in the top 3 cm and the remaining base roots. Roots were oven dried at 70 �C to a constant weight and weighted.
试验结束时,剪下地上部分,用自来水冲洗后于70 °C烘干至恒重并称重。将叶片与茎分离后分别称重和取样。将盆内生长基质(包括土壤、生物固体和根系)的表层3 cm切下,与下方其余部分分开。轻轻刷去根系上的全部土壤,用自来水冲洗后,分别对表层3 cm根系和其余底部根系取样。根系于70 °C烘干至恒重并称重。
2.3. Rhizobox experiment setup2.3. 根箱试验设计
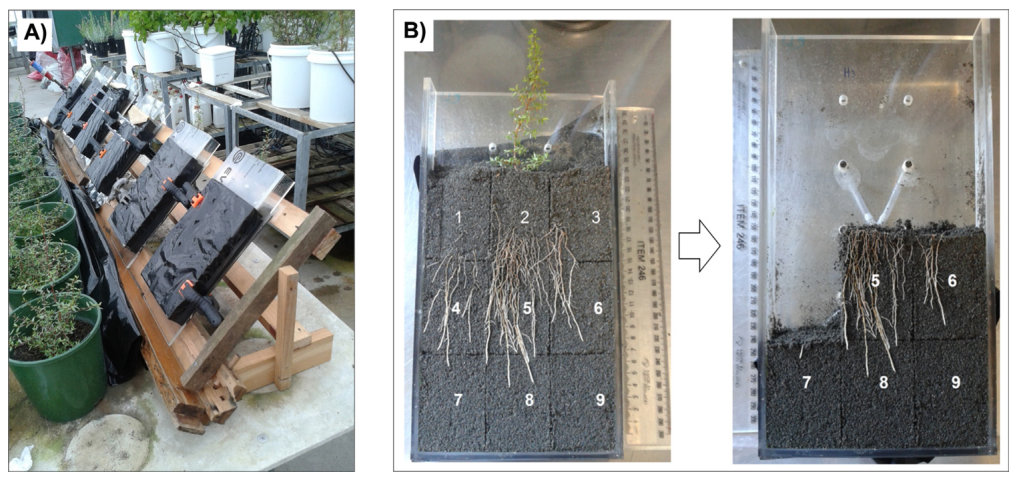
Rhizoboxes are transparent perspex boxes that allow the visualisation of root growth (Moradi et al., 2010; Wenzel et al., 2001). We used 12 rhizoboxes with internal dimensions of 15 � 30 � 2.5 cm, with 10 holes drilled through the back plate used for even irrigation across the box (Fig. 1).
根箱是可观察根系生长的透明有机玻璃箱(Moradi et al., 2010; Wenzel et al., 2001)。本研究使用12个内部尺寸为15 × 30 × 2.5 cm的根箱,背板上钻有10个孔,用于整个箱体的均匀灌溉(图1)。
The rhizobox trial used S1, allowing for a greater contrast than S2 between treatments with and without biosolids. For this experiment, soil material and biosolids were sieved to <2 mm. Three treatments with four replicates comprised: i) control soil without biosolids (S1), ii) biosolids homogeneously incorporated into soil at 10% fresh weight (S1+M, mixed), iii) same amount of biosolids concentrated in just one vertical band of the rhizobox (S1 +V, vertical). The third treatment aimed to provide an analogue of a possible soil environment following biosolids incorporation using strip tilling.
根箱试验采用S1,因为与S2相比,其在施用与不施用生物固体的处理之间可形成更大的对比。本试验中,土壤材料和生物固体均过<2 mm筛。设三个处理,每个处理四次重复:i)不施生物固体的对照土壤(S1);ii)生物固体按鲜重10%均匀混入土壤(S1+M,混合);iii)等量生物固体集中于根箱内的一条垂直条带(S1 +V,垂直)。第三个处理旨在模拟采用条带耕作混入生物固体后可能形成的土壤环境。
In the control treatment, 1.05 kg of S1 was packed horizontally in four layers of approximately 262 g (field moist) to maintain a similar bulk density (of approximately 0.93 g cm3) along the whole rhizobox. The biosolids-incorporated treatment consisted of an evenly distributed mixture of biosolids and S1. Each rhizobox had 1.11 kg of the mixture S1 + biosolids, maintaining the biosolids at 10% concentration. In the vertical application treatment, the rhizobox was divided into two sections (one third and two thirds of width). A thin plastic barrier was positioned at the division point to help with the substrate allocation leaving 10 cm on one side and 5 cm on the other. In the 10 cm section, 1 kg of soil 1 was carefully added while the 5 cm section received the mixture soil 1 + biosolids at 10% of the total box weight. The barrier was then carefully removed.
对照处理中,将1.05 kg S1分四层水平装填,每层约262 g(田间湿度),以使整个根箱保持相近的容重(约0.93 g cm3)。生物固体混入处理为生物固体与S1的均匀混合物,每个根箱装入1.11 kg S1 + 生物固体混合物,生物固体浓度保持为10%。垂直施用处理中,根箱被分为两部分(宽度的三分之一和三分之二)。在分隔处放置一块薄塑料隔板以辅助基质分配,一侧留出10 cm,另一侧留出5 cm。在10 cm部分小心加入1 kg土壤1,而5 cm部分装入土壤1 + 生物固体混合物,生物固体占箱内总重的10%。随后小心取出隔板。
L. scoparium seedlings were carefully transplanted from the seedling tray to the rhizobox after having all the potting mixture removed from the roots by gentle brushing. To ensure root growth along the transparent lid, the rhizoboxes were placed on a 45� angle, using a purpose-built stand (Fig. 1A). Black plastic was placed around the rhizoboxes to prevent light encouraging biofilm growth at the soil-rhizobox interfaces. The rhizoboxes were positioned on the stand in a randomised pattern and maintained in the greenhouse for 9 weeks. Watering occurred 6 days per week using a spray bottle for top applications and a syringe for applying water through the holes of the rhizoboxes. The watering maintained the rhizoboxes at field capacity with amounts applied varying according to evapotranspiration, ranging between 5 ml to 15 ml per day. After 40 days, the lid of the rhizobox was temporarily removed so the roots could be scanned for monitoring the root growth. This process occurred weekly for 4 weeks, using a Canon scanner (CanoScan LIDE 210).
轻轻刷去根系上的全部育苗基质后,将L. scoparium幼苗从育苗盘小心移栽至根箱。为确保根系沿透明盖板生长,利用专门制作的支架将根箱倾斜45°放置(图1A)。根箱四周覆盖黑色塑料,以防止光照促进土壤—根箱界面上生物膜的生长。根箱按随机方式放置于支架上,在温室中培养9周。每周浇水6天,表面浇水使用喷壶,通过根箱孔洞注水则使用注射器。浇水量根据蒸散量调整,每天5 ml至15 ml,使根箱保持田间持水量。40天后,暂时取下根箱盖板,扫描根系以监测根系生长。该过程每周进行一次,持续4周,使用佳能扫描仪(CanoScan LIDE 210)。
At the end of the experiment, when the roots on the fastest growing treatment (vertical band) reached the edges of the rhizobox, the shoots were cut and rinsed with deionized water. For the root collection, the soil material from each rhizobox was divided in 9 equally-sized sectors (Fig.1B), with the heterogeneous biosolids treatments encapsulated precisely within three sectors.
试验结束时,即生长最快的处理(垂直条带)的根系到达根箱边缘时,剪下地上部分并用去离子水冲洗。为收集根系,将每个根箱中的土壤材料划分为9个大小相等的区块(图1B),非均匀生物固体处理恰好包含在其中三个区块内。
The roots were then collected from each sector, washed with tap water and sampled individually. All plant material was oven dried at 70 �C until constant weight was obtained.
随后从每个区块收集根系,用自来水冲洗后分别取样。所有植物材料均于70 °C烘干至恒重。
2.4. Chemical analysis2.4. 化学分析
The fresh samples of soils, biosolids, and amended soils were sieved (<2 mm), and ammonia and nitrate concentrations were determined on 2 M KCl extracts (Clough et al., 2001) and analysed with a Flow Injection Analyser (FOSS FIAstar 5000). Sieved samples of soil, biosolids and amended soils were then dried at room temperature and analysed for pH and electrical conductivity in a 1:2.5 (w:v) soil-water ratio (Blakemore et al., 1987). Pseudo-total elements of the soil, biosolids and biosolids-amended soil were extracted using the microwave CEM MARS Xpress acid digest technique (0.5 g substrate, 4.0 ml trace element grade nitric acid (69%) and 4.0 ml 30% hydrogen peroxide, according to the equipment specifications, (Al Mamun et al., 2016)). The exchangeable fraction of elements were extracted with 0.05 M Ca(NO3)2 (McLaren et al., 2005). The Olsen P was extracted with 0.5 M NaHCO3 according to Olsen et al. (1954). Extracts of pseudototal, exchangeable elements and Olsen P were analysed by ICP-OES (Varian 720-ES). Total carbon and nitrogen concentration were determined using an Elementar Vario-Max CN Elemental Analyser.
土壤、生物固体和改良土壤的新鲜样品过筛(<2 mm)后,用2 M KCl浸提测定铵态氮和硝态氮浓度(Clough et al., 2001),并用流动注射分析仪(FOSS FIAstar 5000)进行分析。过筛后的土壤、生物固体和改良土壤样品在室温下风干,按1:2.5(w:v)土水比测定pH和电导率(Blakemore et al., 1987)。土壤、生物固体和生物固体改良土壤中元素的准全量采用CEM MARS Xpress微波酸消解技术提取(0.5 g基质,4.0 ml微量元素级硝酸(69%)和4.0 ml 30%过氧化氢,按照仪器说明操作(Al Mamun et al., 2016))。元素的交换态组分用0.05 M Ca(NO3)2提取(McLaren et al., 2005)。Olsen P按照Olsen et al. (1954)的方法用0.5 M NaHCO3提取。准全量、交换态元素和Olsen P的提取液采用ICP-OES(Varian 720-ES)分析。全碳和全氮浓度采用Elementar Vario-Max CN元素分析仪测定。
L. scoparium leaves were analysed for N and C using the CN Elemental analyser. The nutrients (P, K, Ca, Mg and S) and trace elements (As, Cd, Cu, Pb and Zn) were extracted from plant samples using the microwave acid digestion technique (CEM MARS Xpress, using 0.3 g dried plant material 2.0 ml trace element grade nitric acid (69%) and 2.0 ml 30% hydrogen peroxide, according to the equipment specifications (Al Mamun et al., 2016)). Analysis of mineral nutrients and trace elements in the extracts of soil and plants were determined by the ICP-OES and expressed on a dry weight basis. Due to the small amount of leaves in the control treatments the minimum weight required for analysis was not reached in all the cases. Therefore, the rhizobox trial did not have the elemental composition analysed in the control treatment. The microwave extraction method was assessed using a reference soil (reference 981) and a reference plant sample (reference 952) from the WEPAL International Soil-Analytical Exchange (www.wepal. nl). We obtained recoveries between 85% and 120%.
L. scoparium叶片的N和C采用CN元素分析仪测定。植物样品中的养分(P、K、Ca、Mg和S)和微量元素(As、Cd、Cu、Pb和Zn)采用微波酸消解技术提取(CEM MARS Xpress,使用0.3 g干燥植物材料、2.0 ml微量元素级硝酸(69%)和2.0 ml 30%过氧化氢,按照仪器说明操作(Al Mamun et al., 2016))。土壤和植物提取液中的矿质养分和微量元素采用ICP-OES测定,并以干重计。由于对照处理中叶片量较少,并非所有样品都达到分析所需的最低重量。因此,根箱试验未对对照处理的元素组成进行分析。微波提取方法采用WEPAL国际土壤分析交换计划(www.wepal. nl)的参考土壤(参考样981)和参考植物样品(参考样952)进行评估,回收率为85%至120%。
2.5. Data analysis2.5. 数据分析
The leaf elemental concentrations were corrected for the fraction of elements in the leaves originating from surfacedeposited dust that may incorporate particles into the waxy layers of the leaves (Robinson et al., 2008). The mass fraction of the soil on the leaf sample, Msoil (mg/kg) was calculated as:
叶片元素浓度针对源自表面沉积粉尘的元素组分进行了校正,这些粉尘可能使颗粒嵌入叶片蜡质层(Robinson et al., 2008)。叶片样品上土壤的质量分数Msoil(mg/kg)按下式计算:

where Tplant is the measured indicator element concentration in the plant tissue (mg kg�1), Rplant is the baseline concentration of the indicator element that the plant has accumulated through the roots and translocated to the shoots (in this case Fe [mg kg�1]), and Tsoil is the concentration of the indicator element in the soil (mg kg�1).
式中,Tplant为植物组织中指示元素的实测浓度(mg kg−1),Rplant为植物经根系吸收并转运至地上部分的指示元素基线浓度(本研究中为Fe [mg kg−1]),Tsoil为土壤中指示元素的浓度(mg kg−1)。
Therefore, the corrected plant concentration of the target element, Cplant* (mg kg�1) was calculated by:
因此,目标元素校正后的植物浓度Cplant*(mg kg−1)按下式计算:

where Cplant and Csoil are the measured concentrations (mg kg�1) of the target element in the plant and soil.
式中,Cplant和Csoil分别为植物和土壤中目标元素的实测浓度(mg kg−1)。
Plant dry weight, percentage of roots in the base part of the pots, shoot: root ratio and concentration of elements were compared between treatments in the two experiments separately with analysis of variance (ANOVA) and post hoc multiple comparison testing (LSD test). Average dry weight of roots in the left and right sides of the rhizoboxes were compared using t-test with paired results. Element concentrations in leaves of L. scoparium in the two treatments of rhizobox experiment were also compared with a t-test. When the hypothesis of normality and homoscedasticity were not fulfilled, data was log transformed. Standardized data of dry weight and N, S, P, Ca, Mg, Na, K, Al, Mn, Zn, Cu, Cd plant concentration was used to do a Principal Component Analysis. Calculations were done with Statgraphics Centurion XVII.
采用方差分析(ANOVA)和事后多重比较检验(LSD检验),分别对两个试验中各处理间的植物干重、盆底部根系所占百分比、地上部:根系比及元素浓度进行比较。根箱左侧和右侧根系的平均干重采用配对t检验进行比较。根箱试验两个处理中L. scoparium叶片的元素浓度也采用t检验进行比较。当数据不满足正态性和方差齐性假设时,对数据进行对数转换。利用干重以及植物中N、S、P、Ca、Mg、Na、K、Al、Mn、Zn、Cu、Cd浓度的标准化数据进行主成分分析。计算使用Statgraphics Centurion XVII完成。
3Results结果
3.1. Plant biomass3.1. 植物生物量
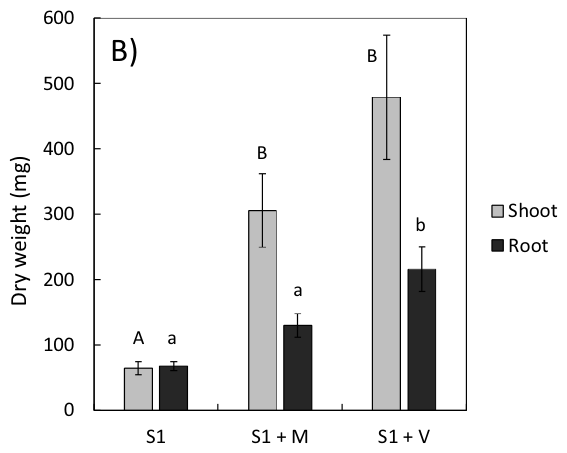
The addition of biosolids to both soils and in the two experiments resulted in a significant increase of total shoot and root dry weight (Fig. 2). However, the response of L. scoparium to biosolids addition depended on the soil type, being more pronounced in S1, which was the soil with the lowest fertility (Table 1). In the pot experiment, shoot dry weights were 30 and 40 times higher in the S1+M and S1+T treatments respectively, compared to S1, while the root weights were 9 and 13 times higher. In the rhizobox experiment, even though the biomass production was ca. tenfold lower than in the pots, shoot dry weights were, respectively, 5 and 7 times higher in the S1+M and S1+V treatments compared to S1, and the root weights were 2 and 3 times higher respectively. The shoot: root ratio in this soil type in both experiments increased in S1+M, +T, +V compared with S1.
在两种土壤和两个试验中,添加生物固体(污泥)均使地上部和根系总干重显著增加(图2)。然而,L. scoparium对生物固体添加的响应取决于土壤类型,在肥力最低的S1中更为明显(表1)。在盆栽试验中,与S1相比,S1+M和S1+T处理的地上部干重分别提高了30倍和40倍,根系重量分别提高了9倍和13倍。在根箱试验中,尽管生物量约比盆栽试验低十倍,但与S1相比,S1+M和S1+V处理的地上部干重分别提高了5倍和7倍,根系重量分别提高了2倍和3倍。在两个试验中,该土壤类型下S1+M、+T、+V处理的地上部:根系比均高于S1。
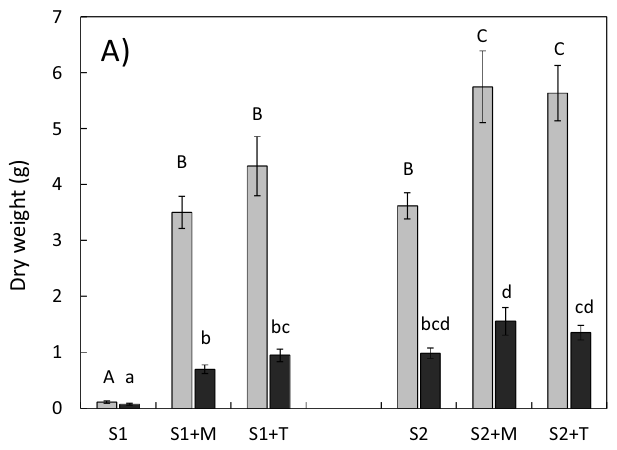
In S2 in the pot experiment, there was a significant increase in shoot dry weight in S2+M and S2+T (ca. 60%), but there was no significant change in root biomass compared to the control. The treatments did not significantly affect the shoot: root ratio.
在盆栽试验的S2中,S2+M和S2+T处理的地上部干重显著增加(约60%),但根系生物量与对照相比无显著变化。各处理对地上部:根系比无显著影响。
3.2. Root distribution3.2. 根系分布
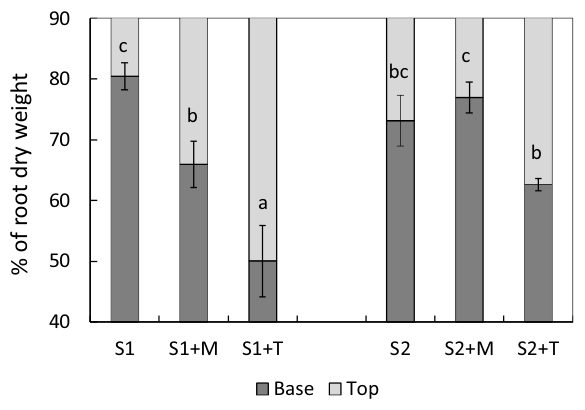
Fig. 3 shows that there was a similar proportion of roots (20– 25%) in the top 3 cm in both control soils, even though the root biomass in S1 was significantly lower than in S2 (Fig. 2). When biosolids were incorporated (S1+M treatment), there was an increased concentration of roots in the surface layer. This effect was not observed in S2.图3表明,尽管S1的根系生物量显著低于S2(图2),但两种对照土壤表层3 cm中的根系比例相近(20– 25%)。混入生物固体后(S1+M处理),表层根系集中程度增加,而S2中未观察到这一效应。
In the treatment where biosolids were applied to the surface (+T), there was an obvious concentration of roots in the top of the pot compared with control and mixed application (+M) (Fig. 3). This effect was more pronounced in S1+T, where half of the root biomass was concentrated in the top 3 cm of the pot, which comprised only 20% of the total soil volume.
在生物固体表面施用处理(+T)中,与对照和混合施用(+M)相比,根系明显集中于盆的上部(图3)。这一效应在S1+T中更为明显,其一半的根系生物量集中在仅占土壤总体积20%的盆表层3 cm中。
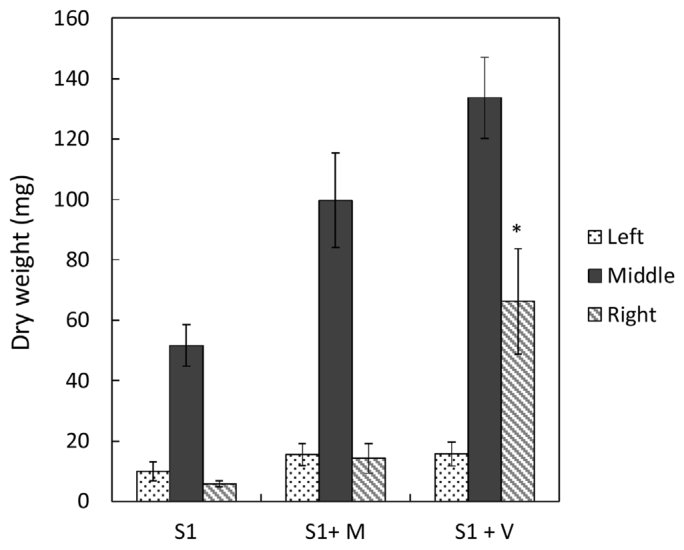
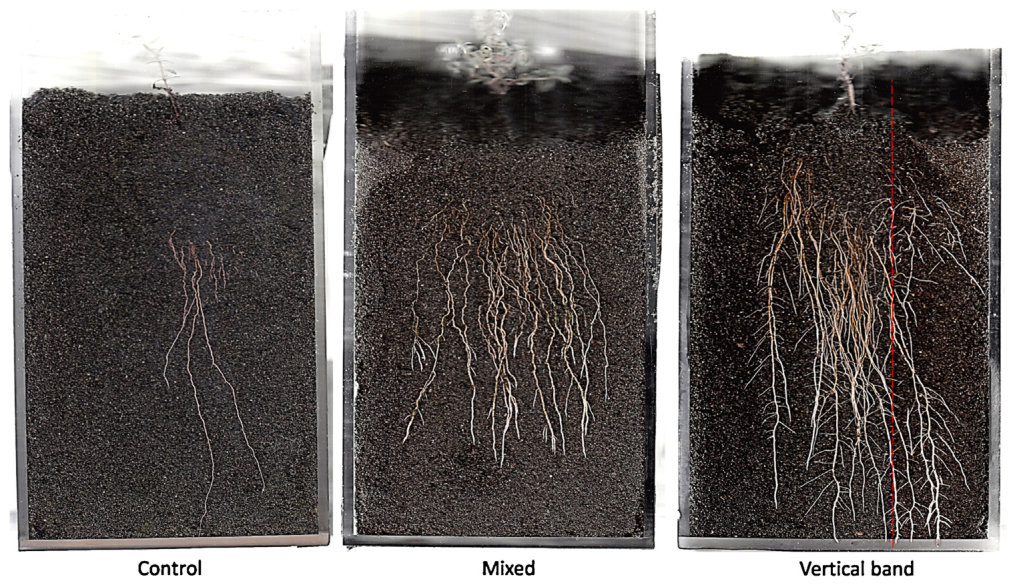
The response of the root system to heterogeneous or homogeneous distribution of biosolids in the rhizobox experiment (Figs. 4 and 5) demonstrated a visible proliferation of the roots in the biosolids vertical band treatment (S1+V). Similar to the results in pot experiment, the rhizobox experiment demonstrated a higher root biomass in the right side of the rhizobox where biosolids are concentrated in the case of vertical application, compared with the control and mixed application (S1 and S1+M) (Fig. 4).
根箱试验中根系对生物固体非均匀或均匀分布的响应(图4和图5)表明,在生物固体垂直条带处理(S1+V)中根系明显增殖。与盆栽试验结果类似,根箱试验表明,与对照和混合施用(S1和S1+M)相比,垂直施用时生物固体集中的根箱右侧根系生物量更高(图4)。
Fig. 5 shows both the proliferation of L. scoparium roots into the vertical band with biosolids by way of creating new lateral roots, and also the main roots growing towards the patch of biosolids.图5显示,L. scoparium根系通过形成新的侧根增殖进入含生物固体的垂直条带,同时主根也朝向生物固体斑块生长。
3.3. Uptake of nutrients and trace elements3.3. 养分和微量元素的吸收
Table 2 shows the concentration of nutrients and trace elements in L. scoparium leaves in both the pot experiment and rhizobox experiment. The control plants in the rhizobox experiment developed insufficient biomass for all chemical analysis. Nitrogen, S and P concentration in L. scoparium leaves increased in the biosolids treatments in both experiments; this effect was more pronounced in S1 than in S2 (Table 1).表2列出了盆栽试验和根箱试验中L. scoparium叶片的养分和微量元素浓度。根箱试验中对照植物的生物量不足以完成全部化学分析。在两个试验中,生物固体处理均使L. scoparium叶片中N、S和P浓度升高;这一效应在S1中比在S2中更为明显(表1)。
The concentrations of K, Mg, Ca and Na were lower in plants growing in the biosolids treatments. However, the concentration of these elements in the soil was unaffected by biosolids addition (Table 1), and the higher biomass in the biosolids treatments may have reduced concentrations through dilution.
生物固体处理中植物的K、Mg、Ca和Na浓度较低。然而,土壤中这些元素的浓度未受生物固体添加的影响(表1),生物固体处理中较高的生物量可能通过稀释作用降低了其浓度。
The Al concentration in biosolids-amended soils was not different from that in S1 & S2. Even with the low pH in S2 amended with biosolids (Table 1), the exchangeable Al concentration was not different from the control. The Al concentration in leaves was the same in S2, S2+M and S2+T. In S1 the Al concentration was higher in S1 and S1+M than in S1+T.
生物固体改良土壤中的Al浓度与S1 & S2无差异。即使S2施用生物固体后pH较低(表1),交换态Al浓度与对照相比也无差异。S2、S2+M和S2+T中叶片Al浓度相同。在S1中,S1和S1+M的Al浓度高于S1+T。
The addition of biosolids increased the concentration of extractable Mn, and the concentration of total and extractable Zn and Cd in both soil types (Table 1). This was reflected in L. scoparium leaves. Mn concentration in leaves was higher in S2+M and S2+T compared with S2, but not in S1. Leaf Zn and Cd concentrations were higher in the treatments than the controls. Leaf Zn and Cd concentrations were affected by the distribution of the biosolids, being higher in the incorporated treatments (+M), except for Zn in S1. Although biosolids significantly increased the soil Cu concentration (Table 1), this was not reflected in the leaf Cu concentration.
添加生物固体提高了两种土壤中可提取态Mn浓度以及全量和可提取态Zn、Cd浓度(表1),这在L. scoparium叶片中也有所体现。S2+M和S2+T叶片中的Mn浓度高于S2,而S1中则不然。各处理叶片Zn和Cd浓度均高于对照。叶片Zn和Cd浓度受生物固体分布方式的影响,在混入处理(+M)中较高,但S1中的Zn除外。尽管生物固体显著提高了土壤Cu浓度(表1),但这并未反映在叶片Cu浓度上。
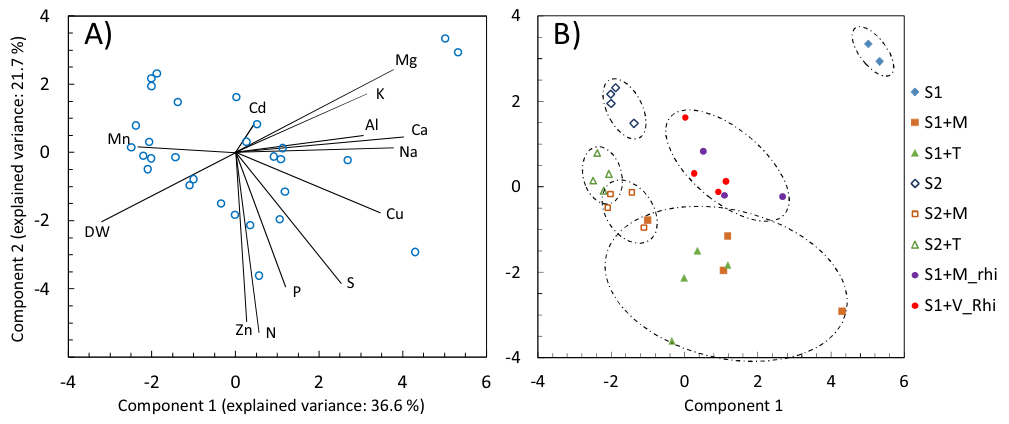
Fig. 6A shows the results of a Principal Component Analysis (PCA) that incorporated the shoot dry weight, and leaf concentrations of N, S, P, Ca, Na, Mg, K, Al, Mn, Zn, Cu, Cd. The first component separated the non-limiting nutrients in the positive part of the axis and dry weight and Mn in the negative part of the axis. The second component was more related to the limiting nutrients (N, P and S) and Zn, but was unrelated to dry weight. Cadmium had a low weighting in both components. Fig. 6B shows the distribution of the results in the two components. The plant response to the treatments was three times greater in S1 compared to S2. The most interesting result of the PCA was that the type of biosolids application affects the results in S2, but not in S1. In S2, results were grouped along axis 2, indicating a concentration gradient of limiting nutrients, where the incorporated application had the highest concentration of limiting nutrients. In S1, there was a large difference between the control and the biosolids application in the two axis, but the distribution of biosolids did not affect the response. While there were two distinct groupings (one for the rhizobox experiment and one for the pot experiment), there was no difference between the mixed, vertical or surface application treatments (Fig. 6B).
图6A显示了主成分分析(PCA)结果,分析变量包括地上部干重以及叶片中N、S、P、Ca、Na、Mg、K、Al、Mn、Zn、Cu、Cd的浓度。第一主成分将非限制性养分分布于轴的正向,将干重和Mn分布于轴的负向。第二主成分与限制性养分(N、P和S)及Zn的关系更为密切,但与干重无关。Cd在两个主成分上的权重均较低。图6B显示了结果在两个主成分上的分布。植物对处理的响应在S1中是S2的三倍。PCA最值得关注的结果是,生物固体施用方式影响S2的结果,但不影响S1。在S2中,结果沿第2轴分组,表明存在限制性养分的浓度梯度,其中混入施用的限制性养分浓度最高。在S1中,对照与生物固体施用在两个轴上差异很大,但生物固体的分布方式并未影响其响应。虽然存在两个明显的分组(一组为根箱试验,一组为盆栽试验),但混合、垂直和表面施用处理之间并无差异(图6B)。
Mean and standard error of element concentration in plant leaves in each treatment and experiments. Different letters indicate significant difference (95%) of element concentration between treatments in pot experiment. * and ** indicates significant differences (95% or 99%) of element concentration between the two treatments in rhizobox experiment.
各处理和试验中植物叶片元素浓度的平均值和标准误。不同字母表示盆栽试验中各处理间元素浓度差异显著(95%)。*和**表示根箱试验两个处理间元素浓度差异显著(95%或99%)。
| Element元素 | Pot experim盆栽试 | ent (n = 4) | Rhizobox expe根箱试 | riment (n = 3)验(n = 3) | ||||||
|---|---|---|---|---|---|---|---|---|---|---|
| S1 | S1 + M | S1 + T | S2 | S2 + M | S2 + T | S1 + M | S1 + V | |||
| N (%) | 1.21 � 0.22 | a 2.61 � 0.16 | c 2.61 � 0.18 | c 1.59 � 0.11 | a | 2.03 � 0.14 | b | 2.08 � 0.07 | b 2.35 � 0.1 | 2.32 � 0.1 |
| P (g kg�1) | 1.5 � 0.04 | bc 2.0 � 0.33 | cd 2.1 � 0.12 | d 0.89 � 0.06 | a | 1.5 � 0.13 | c | 0.95 � 0.12 | ab 0.810 � 0.110 | 0.740 � 0.08 |
| S (g kg�1) | 2.2 � 0.17 | ab 3.9 � 0.86 | c 3.6 � 0.47 | bc 1.3 � 0.16 | a | 2.0 � 0.09 | a | 1.9 � 0.09 | a 4.500 � 0.740 | 2.400 � 0.25 * |
| K (%) | 1.35 � 0.05 | b 0.89 � 0.10 | a 0.78 � 0.02 | a 0.82 � 0.02 | a | 0.85 � 0.02 | a | 0.79 � 0.02 | a 0.79 � 0.07 | 0.77 � 0.04 |
| Ca (%) | 2.6 � 0.12 | d 1.24 � 0.08 | c 1.37 � 0.07 | c 0.59 � 0.02 | a | 0.84 � 0.03 | b | 0.77 � 0.06 | ab 1.4 � 0.06 | 1.54 � 0.08 |
| Mg (g kg�1) | 5.6 � 0.14 | c 2.2 � 0.16 | b 2.0 � 0.05 | ab 1.9 � 0.05 | ab | 1.9 � 0.10 | ab | 1.7 � 0.15 | a 3.8 � 0.14 | 2.9 � 0.17 |
| Na (g kg�1) | 2.4 � 0.11 | d 1.2 � 0.16 | bc 1.6 � 0.15 | c 0.93 � 0.06 | ab | 0.70 � 0.08 | a | 0.88 � 0.16 | ab 1.8 � 0.21 | 1.4 � 0.06 |
| Mn (mg kg�1) | 186 � 9.5 | b 110 � 14 | a 230 � 23 | b 251 � 16 | b | 596 � 47 | c | 633 � 171 | c 331 � 31 | 191 � 20 |
| Al (mg kg�1) | 167 � 64 | c 154 � 63 | bc 29 � 1.8 | a 76 � 11 | abc | 79 � 8.5 | abc | 56 � 8.5 | ab 98 � 24 | 48 � 12 |
| Cu (mg kg�1) | 10.6 � 0.7 | b 10.5 � 2.2 | b 7.0 � 0.4 | a 3.8 � 0.2 | a | 6.4 � 0.3 | a | 5.3 � 0.5 | a 7.3 � 1.2 | 5.4 � 0.5 |
| Zn (mg kg�1) | 42 � 1.0 | a 135 � 12 | bc 211 � 8.0 | d 20 � 1.2 | a | 153 � 13 | c | 107 � 12 | b 145 � 12 | 146 � 19 |
| Cd (mg kg�1) | 0.0 � 0.0 | a 0.26 � 0.15 | a 0.19 � 0.04 | a 0.06 � 0.03 | a | 0.57 � 0.12 | b | 0.19 � 0.04 | a 1.55 � 0.66 | 0.52 � 0.09 |
4Discussion讨论
4.1. The better growth and nutrient status of L. scoparium in biosolids-amended soils4.1. 生物固体改良土壤中L. scoparium生长和养分状况的改善
Biosolids addition to the two low fertility soils improved the growth and the nutrient status of L. scoparium, regardless the type of biosolids application. The improvement was more pronounced, though, in S1 than in S2. The low levels of nutrients and high pH in S1, compared with S2, may account for the better response of L. scoparium when biosolids are added. The greater amelioration of soil conditions when biosolids were applied to sand (such as S1), compared with soil substrates (such as S2) was reported by Sarooshi et al. (2002). This effect was not only evident by the dry weight, but also by the distribution of biomass between shoots and roots. Only in S1 treatment did the shoot: root ratio change. Our results are consistent with Mata-González et al. (2002), who found a larger shoot: root ratio in two perennial grasses with increased biosolids application rate. This can be explained by the severe macronutrient deficiency in S1, which induces a higher investment in root than in shoot growth (Marschner, 2012). We can identify N, S and P as the limiting macronutrients in both soils, since they were the ones with the greatest increase in L. scoparium leaves when biosolids were added, above all in the case of S1. Only in biosolids-amended soils were the levels of nutrients in leaves comparable to New Zealand native vegetation in natural areas (Hahner et al., 2014).
无论生物固体(污泥)以何种方式施用,在两种低肥力土壤中添加生物固体均改善了L. scoparium的生长和养分状况。不过,这种改善在S1中比在S2中更为明显。与S2相比,S1养分水平低、pH高,这可能是添加生物固体后L. scoparium响应更好的原因。Sarooshi et al. (2002)报道,与土壤基质(如S2)相比,生物固体施用于砂土(如S1)时对土壤条件的改善更大。这一效应不仅体现在干重上,也体现在生物量在地上部和根系之间的分配上。只有S1处理的地上部:根系比发生了变化。本研究结果与Mata-González et al. (2002)一致,他们发现随生物固体施用量增加,两种多年生禾草的地上部:根系比增大。这可以用S1中严重的大量养分缺乏来解释,这种缺乏促使植物对根系生长的投入高于地上部(Marschner, 2012)。可以确定N、S和P为两种土壤中的限制性大量养分,因为添加生物固体后L. scoparium叶片中这些元素的增幅最大,尤其是在S1中。只有在生物固体改良土壤中,叶片养分水平才与自然区域中新西兰本土植被相当(Hahner et al., 2014)。
4.2. The foraging behaviour of L. scoparium roots in biosolids4.2. L. scoparium根系在生物固体中的觅食行为
The results demonstrate morphological foraging of L. scoparium roots into or near biosolids (when they are surface applied or in a vertical band). This proliferation was more pronounced in S1, due to the large difference in nutrient status between this soil and biosolids, a phenomenon explained by Hodge, (2004). This positive growth effect could be due to sensing a chemical gradient or even the presence of a signalling mechanism in this species (Ruffel et al., 2011). However, further research is needed to confirm a chemical gradient that might be detected by the plant roots.
结果表明,L. scoparium根系对生物固体内部或其附近(表面施用或垂直条带施用时)存在形态觅食行为。这种增殖在S1中更为明显,原因在于该土壤与生物固体之间的养分状况差异较大,Hodge, (2004)对此现象进行了解释。这种正向生长效应可能源于对化学梯度的感知,甚至可能源于该物种存在某种信号传导机制(Ruffel et al., 2011)。然而,还需进一步研究以确认可能被植物根系感知的化学梯度。
Root foraging by L. scoparium is contrary to the general assumption that species adapted to low fertility environments would not show morphological plasticity for the acquisition of nutrients (Hutchings and De Kroon, 1994). Watson and O’Loughlin (1985) showed that more than 90% of root length of L. scoparium roots were in the diameter class between 2 and 20 mm, being only 20% of the root biomass. According to Hodge (2004) plants with higher specific root length (root length per unit mass) are more prone to rapid root proliferation in high nutrient patches.
L. scoparium的根系觅食行为与一般假设相反,即适应低肥力环境的物种在养分获取方面不会表现出形态可塑性(Hutchings and De Kroon, 1994)。Watson and O’Loughlin (1985)表明,L. scoparium超过90%的根长属于直径2至20 mm的径级,而这部分仅占根系生物量的20%。根据Hodge (2004),比根长(单位质量根长)较高的植物更易于在高养分斑块中快速增殖根系。
In the treatments with heterogeneous application of biosolids (top application in pot experiment or vertical band application in rhizobox one), only part of the root biomass was in direct contact with biosolids, compared with the mixed application treatments, where the whole root system was in contact with the biosolids. Even so, the total nutrient extraction (Reis, 2015) and the plant growth were unaffected by the type of application.
在生物固体非均匀施用处理(盆栽试验中的表面施用或根箱试验中的垂直条带施用)中,只有部分根系生物量与生物固体直接接触,而在混合施用处理中,整个根系均与生物固体接触。即便如此,养分总吸收量(Reis, 2015)和植物生长均未受施用方式的影响。
4.3. Trace elements and toxicity of biosolids4.3. 生物固体的微量元素与毒性
As reported in other studies (Knowles et al., 2011; Mosquera- Losada et al., 2010), Zn is the one of the most abundant trace element in the biosolids used in our experiments (1239 mg kg�1). However, the increased Zn concentration in leaves is unlikely to cause toxicity, either to the plant (where tolerable levels are <100– 300 mg kg�1, Marschner, 2012) or to animals (tolerable levels are <300–500 mg kg�1, Chaney, 1989). The Cd concentrations were within the range found in different vegetables (Bešter et al., 2013) and are unlikely to pose a risk to plant health (where tolerable levels are <5 mg kg�1, Marschner, 2012). However, in the treatments where the biosolids were incorporated into the soil (+M), the Cd concentration was close to the tolerable levels for livestock (<0.5 mg kg�1, Chaney, 1989). Potentially, elevated Mn may be phytotoxic in S2 with treatments, since its concentration was higher than 400 mg kg�1 (Chaney, 1989).
与其他研究报道一致(Knowles et al., 2011; Mosquera- Losada et al., 2010),Zn是本试验所用生物固体中含量最高的微量元素之一(1239 mg kg−1)。然而,叶片中Zn浓度的升高不太可能对植物(耐受水平为<100– 300 mg kg−1,Marschner, 2012)或动物(耐受水平为<300–500 mg kg−1,Chaney, 1989)造成毒害。Cd浓度处于各类蔬菜中的浓度范围内(Bešter et al., 2013),不太可能对植物健康构成风险(耐受水平为<5 mg kg−1,Marschner, 2012)。然而,在生物固体混入土壤的处理(+M)中,Cd浓度接近家畜的耐受水平(<0.5 mg kg−1,Chaney, 1989)。由于S2各处理中Mn浓度高于400 mg kg−1(Chaney, 1989),升高的Mn可能具有植物毒性。
Even though the pH in S2 was low (4.3) in the treatment, there was no evidence of Al toxicity caused by biosolids, since P, Ca and Mg concentrations in leaves (nutrients that are affected by Al toxicity in acidic soils, (Marschner, 2012)) were not lower than in control. The significant difference in leaf Ca and Mg concentration in all treatments in S2 compared with S1 could be attributed to the different concentration of these nutrients in soils, rather than pH difference (Table 1).
尽管S2处理中pH较低(4.3),但没有证据表明生物固体引起了Al毒害,因为叶片中P、Ca和Mg(酸性土壤中受Al毒害影响的养分(Marschner, 2012))的浓度并不低于对照。S2所有处理叶片Ca和Mg浓度与S1相比的显著差异,可归因于土壤中这些养分浓度的不同,而非pH差异(表1)。
4.4. Implications for biosolids application method4.4. 对生物固体施用方式的启示
The application of biosolids in low fertility soils could accelerate the growth of L. scoparium, especially if this species were to be planted soils with low fertility and high pH (such as S1). Due to the foraging behaviour of L. scoparium roots into or near the biosolids, the nature of the biosolids application would not greatly affect growth and nutrient status. Although L. scoparium root system is characterized by shallow roots with a strong tendency for lateral roots in the top 20 cm of soils (Watson and O’Loughlin, 1985), a surface application may induce an inordinately high proliferation of roots at the soil surface (up to 50% of total root biomass, Fig. 3). According to Roychoudhry and Kepinski (2015), surface root proliferation may result in the physical instability of the plant and reduce access to water deep in the soil profile during times of drought. Alternatively, the mixed or the vertical band application (to replicate strip tilling incorporation), could induce the development of a bigger and deeper root system. In any case, the uptake of trace elements should not pose a problem.
在低肥力土壤中施用生物固体可加速L. scoparium的生长,尤其是当该物种种植于低肥力、高pH的土壤(如S1)时。由于L. scoparium根系对生物固体内部或其附近的觅食行为,生物固体的施用方式不会对其生长和养分状况产生很大影响。尽管L. scoparium根系的特点是根浅,且在土壤表层20 cm内有强烈的侧根发育倾向(Watson and O’Loughlin, 1985),但表面施用可能导致根系在土壤表面过度增殖(可达根系总生物量的50%,图3)。根据Roychoudhry and Kepinski (2015),表层根系增殖可能导致植物物理稳定性下降,并在干旱期间减少对土壤剖面深层水分的获取。而混合施用或垂直条带施用(模拟条带耕作混入)则可促使形成更大、更深的根系。无论何种情况,微量元素的吸收都不应构成问题。
If the nutrient deficiency is less severe (such as in S2), the surface application of biosolids would not induce such a high location of roots in the soil surface. In this case, surface application might be a better option for economic reasons, and also for reducing the risk of trace element accumulation in aerial parts.
如果养分缺乏不太严重(如S2),生物固体表面施用不会导致根系在土壤表面如此高度集中。在这种情况下,出于经济原因以及降低微量元素在地上部积累的风险,表面施用可能是更好的选择。
Further research is necessary to better understand the response of L. scoparium to different doses of biosolids application in more realistic scenarios at the field scale. Moreover, the leachate and distribution of nutrients and trace elements in soil are also an important factors to take into account when soil amendment programs are designed (Knowles et al., 2011).
需要进一步研究,以更好地了解在田间尺度更接近实际的情景下L. scoparium对不同生物固体施用剂量的响应。此外,在设计土壤改良方案时,养分和微量元素的淋溶及其在土壤中的分布也是需要考虑的重要因素(Knowles et al., 2011)。
5Conclusions结论
L. scoparium responded positively to biosolids application by increasing dry weight and improving its nutrient status. The foraging behaviour of its roots allowed L. scoparium to adapt to a heterogeneous distribution of biosolids. As a result, the growth and nutrient status of L. scoparium was similar regardless the type of biosolids application (top, mixed or concentrated in a vertical band). However, there are some concerns about biosolids management that should be taken into account at the field scale. If the soil to be amended is extremely low in nutrients or organic matter, as is the case in S1, surface application of biosolids could induce a large concentration of roots in the surface. However, if the soil conditions are not too extreme (such as soil S2), a surface application could be more desirable, as it is more economic and less likely to increase the concentration of potentially toxic elements. A heterogeneous incorporation of biosolids, like strip tilling, might be an intermediate solution, forcing roots to grow deeper and decreasing the amount of roots in direct contact with biosolids and so with trace elements. Further experiments with more realistic scenarios at the field scale are needed to better understand the response of L. scoparium to biosolids application and to study the movement and leachate of nutrients and trace elements depending on type of application.
L. scoparium对生物固体(污泥)施用表现出积极响应,干重增加,养分状况得到改善。其根系的觅食行为使L. scoparium能够适应生物固体的非均匀分布。因此,无论生物固体以何种方式施用(表面、混合或集中于垂直条带),L. scoparium的生长和养分状况均相近。然而,在田间尺度上,生物固体管理中仍有一些问题需要考虑。如果待改良土壤的养分或有机质极低(如S1),生物固体表面施用可能导致根系大量集中于表层。然而,如果土壤条件不太极端(如土壤S2),表面施用可能更为可取,因为其更经济,且不太可能提高潜在有毒元素的浓度。生物固体的非均匀混入(如条带耕作)可能是一种折中方案,可促使根系向深处生长,并减少与生物固体及其所含微量元素直接接触的根系数量。需要在田间尺度更接近实际的情景下开展进一步试验,以更好地了解L. scoparium对生物固体施用的响应,并研究养分和微量元素随施用方式不同的迁移和淋溶。
Acknowledgements致谢
We gratefully acknowledge the Centre for Integrated Biowaste Research, who funded this study and to Lincoln University for financial support to FVP Reis. Dr. MJ Gutiérrez-Ginés holds a fellowship granted by Fundación Ramón Areces. We thank Kaikoura District Council for access to Kaikoura Water Treatment Plant and to Lincoln University and Ngai Tahu for access to Eyrewell Forest.
感谢Centre for Integrated Biowaste Research资助本研究,感谢Lincoln University为FVP Reis提供经费支持。MJ Gutiérrez-Ginés博士获得Fundación Ramón Areces资助的研究奖学金。感谢Kaikoura District Council允许进入Kaikoura污水处理厂,并感谢Lincoln University和Ngai Tahu允许进入Eyrewell林区。
References参考文献
ANZBP, 2016 Australian and New Zealand Biosolids Partnership [WWW Document]. URL http://www.biosolids.com.au/bs-nz.php, (accessed 7.1.16).
Al Mamun, S., Chanson, G., Muliadi Benyas, E., Aktar, M., Lehto, N., McDowell, R., Cavanagh, J., Kellermann, L., Clucas, L., Robinson, B., 2016. Municipal composts reduce the transfer of Cd from soil to vegetables. Environ. Pollut. 213, 8–15. doi: http://dx.doi.org/10.1016/j.envpol.2016.01.072.
Alvarez, R., Steinbach, H.S., 2009. A review of the effects of tillage systems on some soil physical properties, water content, nitrate availability and crops yield in the Argentine Pampas. Soil Tillage Res. 104, 1–15. doi:http://dx.doi.org/10.1016/j. still.2009.02.005.
Arduini, I., Godbold, D.L., Otinis, A., 1994. Cadmium and copper change root growth and morphology of Pinus pinea and Pinus pinaster seedlings. Physiol. Plant. 675–680.
Barbarick, K.A., Ippolito, J.A., McDaniel, J., Hansen, N.C., Peterson, G.A., 2012. Biosolids application to no-till dryland agroecosystems. Agric. Ecosyst. Environ. 150, 72–81. doi:http://dx.doi.org/10.1016/j.agee.2012.01.012.
Bešter, P.K., Lobnik, F., Eržen, I., Kastelec, D., Zupan, M., 2013. Prediction of cadmium concentration in selected home-produced vegetables. Ecotoxicol. Environ. Saf. 96, 182–190. doi:http://dx.doi.org/10.1016/j.ecoenv.2013.06.011. Blakemore, L.C., Searle, P.L., Daly, B.K., 1987. Methods for chemical analysis of soils. NZ Soil Bur. Sci. Rep. 80, 27–29. Bradley, J., 2008. New Zealand. In: LeBlanc, R.J., Matthews, P., Richard, R.P. (Eds.), Global Atlas of Excreta, Wastewater Sludge, and Biosolids Management: Moving Forward the Sustainable and Welcome Uses of a Global Resource. United Nations Human Settlements Programme (UN-HABITAT), Nairobi, pp. 447–454. Castillo, M.S., Sollenberger, L.E., Vendramini, J.M.B., Woodard, K.R., O’Connor, G.A., Silveira, M.L., Sartain, J.B., 2011. Incorporation of municipal biosolids affects organic nitrogen mineralization and elephantgrass biomass production. Agron. J. 103, 899–905. doi:http://dx.doi.org/10.2134/agronj2010.0497.
Chaney, R.L., 1989. Toxic element accumulation in soils and crops: protecting soil fertility and agricultural food-chains. In: Bar-Yosef, B., Barrow, N.J., Goldshmid, J. (Eds.), Inorganic Contaminants in the Vadose Zone. Springer-Verlag, Berlin, pp. 140–158.
Clough, T.J., Stevens, R.J., Laughlin, R.J., Sherlock, R.R., Cameron, K.C., 2001. Transformations of inorganic-N in soil leachate under differing storage conditions. Soil Biol. Biochem. 33, 1473–1480. doi:http://dx.doi.org/10.1016/ S0038-0717(01)00056-6.
Hahner, J.L., Robinson, B.H., Hong-Tao, Z., Dickinson, N.M., 2014. The phytoremediation potential of native plants on New Zealand dairy farms. Int. J. Phytoremediation 16, 719–734. doi:http://dx.doi.org/10.1080/ 15226514.2013.856845. Hewitt, A.E., 2010. New Zealand Soil Classification, 3rd edition Manaaki Whenua Press, Lincoln, New Zealand.
Hodge, A., 2004. The plastic plant: root responses to heterogeneous supplies of nutrients. New Phytol. 162, 9–24. doi:http://dx.doi.org/10.1111/j.1469- 8137.2004.01015.x.
Hutchings, M.J., De Kroon, H., 1994. Foraging in Plants: the Role of Morphological Plasticity in Resource Acquisition, Advances in Ecological Research. Elsevier Masson SAS doi:http://dx.doi.org/10.1016/S0065-2504(08)60215-9.
Jiao, W., Chen, W., Chang, A.C., Page, A.L., 2012. Environmental risks of trace elements associated with long-term phosphate fertilizers applications: a review. Environ. Pollut. 168, 44–53. doi:http://dx.doi.org/10.1016/j. envpol.2012.03.052.
Knowles, O.A., Robinson, B.H., Contangelo, A., Clucas, L., 2011. Biochar for the mitigation of nitrate leaching from soil amended with biosolids. Sci. Total Environ. 409, 3206–3210. doi:http://dx.doi.org/10.1016/j.scitotenv.2011.05.011.
Loganathan, P., Hedley, M.J., Grace, N.D., Lee, J., Cronin, S.J., Bolan, N.S., Zanders, J.M., 2003. Fertiliser contaminants in New Zealand grazed pasture with special reference to cadmium and fluorine: a review. Aust. J. Soil Res. 41, 501–532. doi: http://dx.doi.org/10.1071/SR02126.
Lu, Q., He, Z.L., Stoffella, P.J., 2012. Land application of biosolids in the USA: A review. Appl. Environ. Soil Sci. 2012 doi:http://dx.doi.org/10.1155/2012/201462.
Marschner, P., 2012. Marschner’s Mineral Nutrition of Higher Plants, Third Edit. Ed. Elsevier Ltd.
Mata-González, R., Sosebee, R.E., Wan, C., 2002. Shoot and root biomass of desert grasses as affected by biosolids application. J. Arid Environ. 50, 477–488. doi: http://dx.doi.org/10.1006/jare.2001.0897.
McLaren, R.G., Clucas, L.M., Taylor, M.D., Hendry, T., 2005. Leaching of macronutrients and metals from undisturbed soils treated with metal-spiked sewage sludge. 3. Distribution of residual metals. Aust. J. Soil Res. 43, 159–170. doi:http://dx.doi.org/10.1071/SR03168.
Moradi, A.B., Oswald, S.E., Nordmeyer-Massner, J.A., Pruessmann, K.P., Robinson, B. H., Schulin, R., 2010. Analysis of nickel concentration profiles around the roots of the hyperaccumulator plant Berkheya coddii using MRI and numerical simulations. Plant Soil 328, 291–302. doi:http://dx.doi.org/10.1007/s11104- 009-0109-8.
Mosquera-Losada, M.R., Muñoz-Ferreiro, N., Rigueiro-Rodríguez, A., 2010. Agronomic characterisation of different types of sewage sludge: policy implications. Waste Manag. 30, 492–503. doi:http://dx.doi.org/10.1016/j. wasman.2009.09.021.
NZTE, 2016. Natural Products. New Zealand Trade & Enterprise (WWW Document). Olsen, S.R., Cole, C.V., Watanabe, F.S., Dean, L.A., 1954. Estimation of Available Phosphorous in Soils by Extraction with Sodium Bicarbonate. .
Reis, F.V.P., 2015. The response of manuka (Leptospermum scoparium) to homogeneous and heterogeneous distribution of biosolids in soil. Lincoln University, New Zealand.
Roberts, L., Brower, A., Kerr, G., Lambert, S., McWilliam, W., Moore, K., Quinn, J., Simmons, D., Thrush, S., Townsend, M., Blaschke, P., Costanza, R., Cullen, R., Hughey, K., Wratten, S., 2015. The Nature of Wellbeing: How Nature’s Ecosystem Services Contribute to the Wellbeing of New Zealand and New Zealanders. Department of Conservation, Wellington, NZ.
Robinson, B.H., Bischofberger, S., Stoll, A., Schroer, D., Furrer, G., Roulier, S., Gruenwald, A., Attinger, W., Schulin, R., 2008. Plant uptake of trace elements on a Swiss military shooting range: uptake pathways and land management implications. Environ. Pollut. 153, 668–676. doi:http://dx.doi.org/10.1016/j. envpol.2007.08.034.
Roychoudhry, S., Kepinski, S., 2015. Shoot and root branch growth angle control-the wonderfulness of lateralness. Curr. Opin. Plant Biol. 23, 124–131. doi:http://dx. doi.org/10.1016/j.pbi.2014.12.004.
Ruffel, S., Krouk, G., Ristova, D., Shasha, D., Birnbaum, K.D., Coruzzi, G.M., 2011. Nitrogen economics of root foraging: transitive closure of the nitrate-cytokinin relay and distinct systemic signaling for N supply vs. demand. Proc. Natl. Acad. Sci. 108, 18524–18529. doi:http://dx.doi.org/10.1073/pnas.1108684108.
Salazar, I., Millar, D., Lara, V., Nuñez, M., Parada, M., Alvear, M., Baraona, J., 2012. Effects of the application of biosolids on some chemical, biological and physical properties in an andisol from Southern Chile. J. Soil Sci. Plant Nutr. 12, 441–450. Sarooshi, R.A., Cresswell, G.C., Tesoriero, L., Milham, P.J., Barchia, I., Harris, A.M., 2002. Effect of biosolids compost on two NSW coastal soils used to grow vegetables. Aust. J. Soil Res. 40, 761–774. doi:http://dx.doi.org/10.1071/SR01114. Singh, R.P., Agrawal, M., 2008. Potential benefits and risks of land application of sewage sludge. Waste Manag. 28, 347–358. doi:http://dx.doi.org/10.1016/j. wasman.2006.12.010.
Speir, T.W., Horswell, J., Van Schaik, A.P., McLaren, R.G., Fietje, G., 2004. Composted biosolids enhance fertility of a sandy loam soil under dairy pasture. Biol. Fertil. Soils 40, 349–358. doi:http://dx.doi.org/10.1007/s00374-004-0787-6.
Stephens, J.M.C., Molan, P.C., Clarkson, B.D., 2005. A review of Leptospermum scoparium (Myrtaceae) in New Zealand. N. Z. J. Bot. 43, 431–449. doi:http://dx. doi.org/10.1080/0028825X.2005.9512966.
Tian, G., Franzluebbers, A.J., Granato, T.C., Cox, A.E., O’Connor, C., 2013. Stability of soil organic matter under long-term biosolids application. Appl. Soil Ecol. 64, 223–227. doi:http://dx.doi.org/10.1016/j.apsoil.2012.12.001.
Wang, H., Magesan, G.N., Kimberley, M.O., Payn, T.W., Wilks, P.J., Fisher, C.R., 2004. Environmental and nutritional responses of a Pinus radiata plantation to biosolids application. Plant Soil 267, 255–262. doi:http://dx.doi.org/10.1007/ s11104-005-0107-4.
Wang, H., Kimberley, M.O., Wilks, P.J., 2013. Economic analysis of a pine plantation receiving repeated applications of biosolids. PLoS One 8, 3–8. doi:http://dx.doi. org/10.1371/journal.pone.0057705.
Watson, A., O’Loughlin, C., 1985. Morphology, strength, and biomass of manuka roots and their influence on slope stability. N. Z. J. For. Sci. 15, 337–348.
Wenzel, W.W., Wieshammer, G., Fitz, W.J., Puschenreiter, M., 2001. Novel rhizobox design to assess rhizosphere characteristics at high spatial resolution. Plant Soil 237, 37–45. doi:http://dx.doi.org/10.1023/A:1013395122730.
Xue, J., Kimberley, M.O., Ross, C., Gielen, G., Tremblay, L.A., Champeau, O., Horswell, J., Wang, H., 2015. Ecological impacts of long-term application of biosolids to a radiata pine plantation. Sci. Total Environ. 530–531, 233–240. doi:http://dx.doi. org/10.1016/j.scitotenv.2015.05.096.