WAste MAnAgeMent
María Jesús Gutiérrez-Ginés,* Brett H. Robinson, Juergen Esperschuetz, Engracia Madejón, Jacqui Horswell, and Roger McLenaghen
1Abstract摘要
Biosolids could potentially be used for reforestation of degraded soils in New Zealand with native vegetation. Many native plant species of New Zealand thrive in low-fertility soils, and there is scant knowledge about their nutrient requirements. Therefore, it is unclear whether they will respond positively to the addition of biosolids. We used a pot trial to determine the responses of 11 native plant species to biosolids addition (10% w/w, ~90 Mg hm−2) on two distinct degraded soils, Lismore stony silt loam and a Kaikōura sand. We also intended to prove that the soil microbial activity improves with the addition of biosolids, depending on the plant species. All species grew better in Lismore stony silt loam than the Kaikōura sand. All species in the Lismore stony silt loam responded positively to biosolids. The response to biosolids addition in the Kaikōura sand was variable, with four species showing no improvement in growth when biosolids were added. The nutrient status (N, P, S, Cu, and Zn) of all species improved when the two soils were amended with biosolids. However, some plant species, especially Pittosporum tenuifolium Sol. ex Gaertn. and Coprosma robusta Raoul, showed concerning concentrations of Cd (up to 2.4 mg kg−1). Dehydrogenase activity of soils (indicator of soil microbial activity) increased in biosolids-amended soils, with a strong species effect. Future work should involve field trials to determine the effect of biosolids addition on the establishment of native plant communities.
生物固体(污泥)有望用于以本土植被对新西兰退化土壤进行重新造林。新西兰许多本土植物种类在低肥力土壤中生长良好,而有关其养分需求的认识十分有限,因此尚不清楚它们对添加生物固体是否会产生正向响应。本研究通过盆栽试验,测定了11种本土植物在两种性质迥异的退化土壤(Lismore多石粉砂壤土和Kaikōura砂土)上对添加生物固体(10% w/w,约90 Mg hm−2)的响应。本研究还旨在证明,添加生物固体可提高土壤微生物活性,且其效果因植物种类而异。所有物种在Lismore多石粉砂壤土中的生长均优于Kaikōura砂土。Lismore多石粉砂壤土中的所有物种对生物固体均表现出正向响应。Kaikōura砂土中植物对添加生物固体的响应不一,其中4个物种在添加生物固体后生长未见改善。两种土壤经生物固体改良后,所有物种的养分状况(N、P、S、Cu和Zn)均得到改善。然而,部分植物种类,尤其是Pittosporum tenuifolium Sol. ex Gaertn.和Coprosma robusta Raoul,表现出令人担忧的Cd浓度(最高达2.4 mg kg−1)。生物固体改良土壤的脱氢酶活性(土壤微生物活性指标)有所提高,且物种效应显著。今后的工作应开展田间试验,以确定添加生物固体对本土植物群落建植的影响。
Core Ideas核心观点
- Adding biosolids to two low-fertility soils had contrasting effects on NZ species.向两种低肥力土壤添加生物固体对新西兰物种产生了截然不同的影响。
- N, S, P, Cu, Mn, and Zn concentrations were higher in plants treated with biosolids.施用生物固体的植物中N、S、P、Cu、Mn和Zn浓度更高。
- New Zealand native dicots accumulated more nutrients than native monocots.新西兰本土双子叶植物比本土单子叶植物积累更多养分。
- Trace element accumulation by some species may present an ecological risk.部分物种对微量元素的积累可能带来生态风险。
- In ecosystem restoration, biosolids may favor weed growth over NZ native plants.在生态系统恢复中,生物固体可能更有利于杂草而非新西兰本土植物的生长。
oil degradation is a global environmental issue affecting up to 6 billion ha (Gibbs and Salmon, 2015). In New SZealand (NZ), some 2.5 million ha of soil are formerly or currently under pine plantation. Due to the falling price of pine (Pinus L. spp.) timber, there is little incentive to replant these degraded soils in pine forests. Former pine forest soils have low organic matter (OM) and nutrients contents. Plantations with non-native species can decrease OM, and harvesting plantations can result in the near-total loss of topsoil (Jurgensen et al., 1997; James and Harrison, 2016). Potentially, the restoration of such degraded soils could be achieved through the addition of exogenous OM (Meyer et al., 2004).
土壤退化是一个全球性环境问题,影响面积多达60亿ha(Gibbs and Salmon, 2015)。在新西兰,约有250万ha土壤过去或目前为松树人工林。由于松树(Pinus L. spp.)木材价格下跌,在这些退化土壤上重新种植松林的动力不足。原松林土壤的有机质(OM)和养分含量较低。非本土物种人工林会降低OM含量,而人工林采伐可导致表土几乎完全流失(Jurgensen et al., 1997; James and Harrison, 2016)。通过添加外源OM,有可能实现此类退化土壤的恢复(Meyer et al., 2004)。
In countries with wastewater treatment facilities, the average fresh sludge production per capita is ~52 kg yr−1, which results in a global output exceeding 10 Tg yr−1 (Bradley, 2008). Studies about land application of sewage sludge and treated municipal wastewater started in the early 1960s Pennsylvania State University. These studies demonstrated the benefits of reusing and recycling those materials on soil physical, chemical, and biological properties (Sopper and Kardos, 1973). Biosolids is a term coined in the United States that is typically used to describe several forms of treated sewage sludge that is intended for agricultural use as a soil conditioner. This treated sewage sludge—or biosolids—can improve the nutrient status of soils and enhance the growth of plants and microbial communities (Singh and Agrawal, 2008). Biosolids have been used worldwide to establish herbaceous native vegetation on degraded soils, such as fire-affected forests (Meyer et al., 2004), quarries (Moreno- Peñaranda et al., 2004), areas with mine activities (Borden and Black, 2011; Montiel-Rozas et al., 2015), overgrazed grasslands (Newman et al., 2014), and urban and industrial areas (Walter and Calvo, 2009). New Zealand produces ~500,000 t of dewatered biosolids per year. Some 60% of these biosolids are landfilled, 10% are discharged in oceans, and only 30% are applied to land (ANZBP, 2016), despite the NZ waste strategy that states that 95% of biosolids should be beneficially reused (Bradley, 2008). Historically, biosolids have been applied to pine plantations, where they accelerate growth at the expense of wood quality (Wang et al., 2004, 2013; Xue et al., 2015).
在拥有污水处理设施的国家,人均新鲜污泥年产量约为52 kg yr−1,全球总产量超过10 Tg yr−1(Bradley, 2008)。有关污水污泥和处理后城市污水土地施用的研究始于20世纪60年代初的宾夕法尼亚州立大学。这些研究表明,对上述物料进行再利用和循环利用有益于土壤的物理、化学和生物学性质(Sopper and Kardos, 1973)。生物固体(biosolids)是美国创造的术语,通常用于指代拟作为土壤调理剂用于农业的多种形式的处理后污水污泥。这种处理后污水污泥(即生物固体)可改善土壤养分状况,促进植物和微生物群落的生长(Singh and Agrawal, 2008)。在世界各地,生物固体已被用于在各类退化土壤上建立草本本土植被,如火灾受损林地(Meyer et al., 2004)、采石场(Moreno- Peñaranda et al., 2004)、矿业活动区(Borden and Black, 2011; Montiel-Rozas et al., 2015)、过度放牧草地(Newman et al., 2014)以及城市和工业区(Walter and Calvo, 2009)。新西兰每年产生约500,000 t脱水生物固体,其中约60%被填埋,10%排入海洋,仅30%施用于土地(ANZBP, 2016),而新西兰废弃物战略规定95%的生物固体应得到有益再利用(Bradley, 2008)。历史上,生物固体曾被施用于松树人工林,其在加速林木生长的同时降低了木材质量(Wang et al., 2004, 2013; Xue et al., 2015)。
Copyright © American Society of Agronomy, Crop Science Society of America, and Soil Science Society of America. 5585 Guilford Rd., Madison, WI 53711 USA. All rights reserved.
版权所有 © American Society of Agronomy, Crop Science Society of America, and Soil Science Society of America。5585 Guilford Rd., Madison, WI 53711 USA。保留所有权利。
J. Environ. Qual. doi:10.2134/jeq2017.04.0139
J. Environ. Qual. doi:10.2134/jeq2017.04.0139
This is an open access article distributed under the terms of the CC BY-NC-ND license (http://creativecommons.org/licenses/by-nc-nd/4.0/) Supplemental material is available online for this article.
本文为依据CC BY-NC-ND许可协议(http://creativecommons.org/licenses/by-nc-nd/4.0/)发布的开放获取文章。本文补充材料可在线获取。
Received 10 Apr. 2017. Accepted 5 June 2017.
*Corresponding author (maria.gines@esr.cri.nz).
M.J. Gutiérrez-Ginés, B.H. Robinson, J. Esperschuetz, and R. McLenaghen, Dep. of Soil and Physical Sciences, Faculty of Agriculture and Life Sciences, Lincoln Univ., New Zealand; M.J. Gutiérrez-Ginés, current address: Institute of Environmental Science and Research, Christchurch Science Centre, 27 Creyke Rd., Christchurch 8041; E. Madejón, Instituto de Recursos Naturales y Agrobiología de Sevilla (IRNAS- CSIC), Spain; J. Horswell, Institute of Environmental Science and Research, Porirua, New Zealand. Assigned to Associate Editor Tracy Punshon.
M.J. Gutiérrez-Ginés、B.H. Robinson、J. Esperschuetz和R. McLenaghen,新西兰林肯大学农业与生命科学学院土壤与物理科学系;M.J. Gutiérrez-Ginés现工作单位:Institute of Environmental Science and Research, Christchurch Science Centre, 27 Creyke Rd., 基督城 8041;E. Madejón,西班牙塞维利亚自然资源与农业生物学研究所(IRNAS- CSIC);J. Horswell,新西兰Porirua,Institute of Environmental Science and Research。责任副主编:Tracy Punshon。
Abbreviations: DHA, dehydrogenase activity; ICP–OES, inductively coupled
缩略语:DHA,脱氢酶活性;ICP–OES,电感耦合
plasma optical emission spectroscopy; MARS, microwave-assisted reaction system; NZ, New Zealand; OM, organic matter; PCA, principal component analysis; S1, Soil 1 without biosolids; S1+B, Soil 1 with biosolids; S2, Soil 2 without biosolids; S2+B, Soil 2 with biosolids.
等离子体发射光谱法;MARS,微波辅助反应系统;NZ,新西兰;OM,有机质;PCA,主成分分析;S1,未添加生物固体的土壤1;S1+B,添加生物固体的土壤1;S2,未添加生物固体的土壤2;S2+B,添加生物固体的土壤2。
By definition, restoration involves putting back what was there previously as completely as possible (Bradshaw, 1984). This implies that native species are required for restoration. Several studies (Kelty, 2006; Chazdon, 2008; Funk et al., 2008; Bremer and Farley, 2010) have highlighted the importance of using a diverse range of native species to increase the invasion resistance (Funk et al., 2008), biodiversity (Bremer and Farley, 2010), and the productivity and heterogeneity in stratification of canopies and roots systems (Kelty, 2006). Chazdon (2008) reported that reclamation and planting with native species is generally the best way to recover biodiversity and ecosystem services in highly degraded lands.
按照定义,恢复是指尽可能完整地重建原有状态(Bradshaw, 1984),这意味着恢复需要采用本土物种。多项研究(Kelty, 2006; Chazdon, 2008; Funk et al., 2008; Bremer and Farley, 2010)强调了使用多样化本土物种的重要性,其可增强抗入侵能力(Funk et al., 2008)、提高生物多样性(Bremer and Farley, 2010),并提高生产力以及冠层和根系分层的异质性(Kelty, 2006)。Chazdon(2008)指出,采用本土物种进行复垦和种植通常是在严重退化土地上恢复生物多样性和生态系统服务的最佳途径。
Many regions in NZ are depauperate in native species. For example, just 0.5% of the Canterbury region is under native vegetation (Ecroyd and Brockerhoff, 2005). There is increasing interest in restoring degraded lands in NZ to native vegetation, which can have economic (Franklin et al., 2015) as well as environmental values (Meurk, 2008; Franklin et al., 2015). Potentially, NZ’s degraded lands could be restored to native vegetation using biosolids (Dickinson et al., 2015). However, it is unclear whether NZ native species will respond positively to elevated concentrations of plant macronutrients and trace elements. There is a paucity of information on the nutrient requirements of NZ native species. Franklin et al. (2015) reported that Kunzea robusta de Lange & Toelken (kānuka), Carex virgata Sol. ex Boott (swamp sedge), Cordyline australis (G. Forst.) Endl (cabbage tree), and Austroderia richardii (Endl.) N.P. Barker & H.P. Linder (toetoe) responded positively to N (200 kg hm−2 eq.), but Leptospermum scoparium J.R.Forst. & G.Forst. (mānuka) did not. Dickinson et al. (2015) reported that biosolids improved the growth of Grisilinea littoralis Raoul (kāpuka) and Kunzea robusta, but not Dodonaea viscosa Jacq. (akeake).
新西兰许多地区本土物种贫乏。例如,坎特伯雷地区仅有0.5%的面积覆盖本土植被(Ecroyd and Brockerhoff, 2005)。将新西兰退化土地恢复为本土植被日益受到关注,这不仅具有经济价值(Franklin et al., 2015),还具有环境价值(Meurk, 2008; Franklin et al., 2015)。新西兰的退化土地有可能借助生物固体恢复为本土植被(Dickinson et al., 2015)。然而,尚不清楚新西兰本土物种对植物大量营养元素和微量元素浓度升高是否会产生正向响应,有关新西兰本土物种养分需求的资料也十分匮乏。Franklin et al.(2015)报道,Kunzea robusta de Lange & Toelken(卡努卡)、Carex virgata Sol. ex Boott(沼泽莎草)、Cordyline australis (G. Forst.) Endl(朱蕉)和Austroderia richardii (Endl.) N.P. Barker & H.P. Linder(toetoe)对N(200 kg hm−2当量)表现出正向响应,而Leptospermum scoparium J.R.Forst. & G.Forst.(麦卢卡)则没有。Dickinson et al.(2015)报道,生物固体促进了Grisilinea littoralis Raoul(kāpuka)和Kunzea robusta的生长,但对Dodonaea viscosa Jacq.(akeake)无促进作用。
The addition of biosolids may also result in increased uptake of trace elements, particularly Zn and Cd (Gartler et al., 2013). Whereas Zn is an essential element that is deficient in many environments, Cd is a nonessential element that may enter food chains and detrimentally affect ecosystems (Madejón et al., 2004). Dickinson et al. (2015) concluded that biosolids had a negligible effect on the trace element concentrations in the foliage of native plants, given the responses of five species in an acidic, low-OM silt that was formerly under pine forestry.
添加生物固体还可能导致植物对微量元素(尤其是Zn和Cd)的吸收增加(Gartler et al., 2013)。Zn是一种在许多环境中缺乏的必需元素,而Cd是一种非必需元素,可能进入食物链并对生态系统产生不利影响(Madejón et al., 2004)。Dickinson et al.(2015)根据5个物种在一种原为松树人工林的酸性低OM粉砂土中的响应得出结论:生物固体对本土植物叶片中微量元素浓度的影响可以忽略。
We hypothesize that the addition of biosolids to poor soils could have contrasting effects on NZ native plants, many of which are adapted to low-fertility soils. Given the results of Dickinson et al. (2015), we hypothesize that biosolids addition will not lead to excessive concentrations of trace elements in the leaves of NZ native species. We also expect an improvement in soil microbial activity (measured by dehydrogenase activity) in biosolids-amended soils.
我们假设,向贫瘠土壤中添加生物固体可能对新西兰本土植物产生截然不同的影响,因为其中许多植物适应低肥力土壤。基于Dickinson et al.(2015)的结果,我们假设添加生物固体不会导致新西兰本土物种叶片中微量元素浓度过高。我们还预期生物固体改良土壤的微生物活性(以脱氢酶活性衡量)将得到提高。
We aimed to determine the growth and elemental concentration profiles of 11 NZ native species in two distinct low-fertility soils. We sought to evaluate the performance of candidate species for the reforestation of degraded soils.
本研究旨在测定11种新西兰本土物种在两种性质迥异的低肥力土壤中的生长状况和元素浓度特征,以评价候选物种在退化土壤重新造林中的表现。
2Materials and Methods材料与方法
Collection of Soils and Biosolids土壤与生物固体的采集
We selected two low-fertility soils, an Orthic Brown Soil (S1) (Hewitt, 2010) from a recently milled Pinus radiata D. Don. plantation in the former Eyrewell Forest, 26 km southeast of Oxford, Canterbury (43°43′87.11′′ S, 172°45′30.79′′ E). The second soil (S2) was a sand under exotic legumes some 5 km north of Kaikōura, Canterbury (42°21′37.7′′ S 173°41′28.1′′ E). Some 400 kg of each soil were collected by removing any surface vegetation and sampling from the top 40 cm. The soils were homogenized and passed through a 20-mm sieve to remove stones while maintaining soil aggregates and structure. Subsamples of both soils were taken for chemical analyses (Table 1). Both soils have low concentrations of OM and plant nutrients. Soil 1 is acidic, whereas S2 is slightly alkaline.
本研究选取两种低肥力土壤。其一为正常棕壤(Orthic Brown Soil,S1)(Hewitt, 2010),采自坎特伯雷Oxford东南26 km处原Eyrewell Forest中一片新近采伐的Pinus radiata D. Don.人工林(43°43′87.11′′ S, 172°45′30.79′′ E)。第二种土壤(S2)为坎特伯雷Kaikōura以北约5 km处外来豆科植物下的砂土(42°21′37.7′′ S 173°41′28.1′′ E)。清除地表植被后,采集表层40 cm土壤,每种土壤约400 kg。土壤经均质化后过20 mm筛以去除石块,同时保持土壤团聚体和结构。取两种土壤的子样品进行化学分析(表1)。两种土壤的OM和植物养分浓度均较低。土壤1呈酸性,而S2呈弱碱性。
Biosolids were collected from a stockpile at the Kaikōura Regional Treatment Works at Kaikōura, Canterbury. Before stockpiling, the biosolids went through an initial treatment of sedimentation and anaerobic digestion in settlement ponds. The biosolids were collected from eight different locations across the pile and bulked. The biosolids (with a water content of 50%) were homogenized and passed through a 20-mm sieve. Table 1 shows the chemical properties of the biosolids.
生物固体采自坎特伯雷Kaikōura的Kaikōura Regional Treatment Works堆场。在堆放之前,生物固体已在沉淀池中经过沉降和厌氧消化的初步处理。从料堆的8个不同位置采集生物固体并混合。生物固体(含水量50%)经均质化后过20 mm筛。表1列出了生物固体的化学性质。
Selection of Plant Species植物种类的选择
The criteria for selecting the native plant species were: (i) hardy species able to grow in open areas, (ii) common in diverse environments and soil conditions, (iii) dry tolerant, and (iv) culturally or economically important (Metcalf, 1991; Salmon, 1991; Crowe, 1997; DOC, 2005). We selected Austroderia richardii, Cordyline australis, Phormium cookianum Le Jol., P. tenax J.R. Forst. & G. Forst, Ozothamnus leptophyllus (G. Forst.) Breitw. & J.M. Ward, Olearia paniculata (J.R. Forst. & G. Forst.) Druce, Coprosma robusta, Coprosma acerosa A. Cunn., Veronica salicifolia G. Forst (syn. Hebe salicifolia (G. Forst.) Pennel), Pittosporum tenuifolium, and Myoporum laetum G .Forst.. Table 2 shows the vernacular names of these plant species, the family, and the growth type. In Table 2, plant species are divided into monocots and dicots. We selected Zea mays L. as a reference species because its response to biosolids addition is well documented.
本土植物种类的选择标准为:(i)能在开阔地生长的耐性强的物种;(ii)在多种环境和土壤条件下常见;(iii)耐旱;(iv)具有文化或经济重要性(Metcalf, 1991; Salmon, 1991; Crowe, 1997; DOC, 2005)。我们选择了Austroderia richardii、Cordyline australis、Phormium cookianum Le Jol.、P. tenax J.R. Forst. & G. Forst、Ozothamnus leptophyllus (G. Forst.) Breitw. & J.M. Ward、Olearia paniculata (J.R. Forst. & G. Forst.) Druce、Coprosma robusta、Coprosma acerosa A. Cunn.、Veronica salicifolia G. Forst(异名Hebe salicifolia (G. Forst.) Pennel)、Pittosporum tenuifolium和Myoporum laetum G .Forst。表2列出了这些植物的俗名、科名和生长类型。表2中将植物种类分为单子叶植物和双子叶植物。由于Zea mays L.对添加生物固体的响应已有充分记载,故选择其作为参照物种。
Experimental Setup试验设计
Biosolids were manually mixed with soil in a proportion of 10% fresh weight (50% moisture, ~90 Mg hm−2 fresh biosolids, ~45 Mg hm−2 of dry biosolids). According to Walter and Calvo (2009), this is an optimal rate for biosolids addition in degraded soils. Pots were filled with 2.5 kg of soil or biosolids-amended soil. The 2.5-L pots (170 ´ 155 mm) had holes in the base. A mesh was set in the bottom to avoid losing soil while facilitating draining. Each plant species was grown in each soil without biosolids (S1 and S2) and each soil with 10% (w/w) biosolids (S1+B, S2+B). Five replicates per treatment and plant species were established. In the case of Z. mays, six replicates per treatment were included. The 244 pots were placed in a randomized block design in the plant growth facilities at Lincoln University (43°38′42′′ S, 172°27′41′′ E). The temperature in the greenhouse ranged between 9 and 20°C during night time (10:00 PM until 6:00 AM) and between 14 and 28°C during the day time.
将生物固体按鲜重10%的比例(含水量50%,约90 Mg hm−2新鲜生物固体,约45 Mg hm−2干生物固体)人工与土壤混合。根据Walter and Calvo(2009),这是退化土壤中生物固体的最佳添加量。每盆装入2.5 kg土壤或生物固体改良土壤。2.5 L花盆(170 × 155 mm)底部有孔,底部铺设网布,以防土壤流失并便于排水。每种植物分别种植于未添加生物固体的两种土壤(S1和S2)以及添加10%(w/w)生物固体的两种土壤(S1+B、S2+B)中。每个处理和植物种类设5个重复,Z. mays每个处理设6个重复。244个花盆按随机区组设计放置于林肯大学植物生长设施中(43°38′42′′ S, 172°27′41′′ E)。温室夜间(22:00至次日6:00)温度为9~20°C,白天为14~28°C。
New Zealand native species were acquired from Waiora Nursery (http://www.waioralandscapes.co.nz) and the Department of Conservation of NZ Nursery, Motukarara (http://www.doc.govt. nz/our-work/motukarara-conservation-nursery/). Plants had an average height of 15 cm. Before planting, roots of plants were washed in tap water to remove as much of the original growth substrate as possible. Plants were watered daily to field (pot) capacity. When the soil in the pots was visually very dry between consecutive irrigation times, the plants were harvested. The growing times for each species were Z. mays: 4.5 wk; M. laetum and H. salicifolia: 9 wk; C. robusta and O. leptophyllus: 15 wk; A. richardii: 19 wk; C. australis, C. acerosa, P. tenuifolium, and P. tenax: 22 wk; P. cookianum: 6 mo; O. paniculata: 6.5 mo.
新西兰本土物种购自Waiora苗圃(http://www.waioralandscapes.co.nz)和新西兰保护部Motukarara苗圃(http://www.doc.govt. nz/our-work/motukarara-conservation-nursery/)。植株平均高度为15 cm。种植前,用自来水冲洗植物根系,尽可能去除原有生长基质。每天浇水至田间(盆栽)持水量。当两次灌溉之间盆中土壤目视非常干燥时,收获植物。各物种的生长时间为:Z. mays,4.5周;M. laetum和H. salicifolia,9周;C. robusta和O. leptophyllus,15周;A. richardii,19周;C. australis、C. acerosa、P. tenuifolium和P. tenax,22周;P. cookianum,6个月;O. paniculata,6.5个月。
At the end of experiment, aboveground parts were cut, washed in tap water, rinsed with deionized water, and oven dried at 65°C for 1 wk. Leaves were separated from stems and stored for chemical analyses. In the case of C. acerosa, which produced fruits during the experiment, fruits were separated and sampled
试验结束时,剪取地上部分,用自来水洗净,再用去离子水冲洗,于65°C烘箱中烘干1周。将叶片与茎分离并保存以供化学分析。C. acerosa在试验期间结出果实,其果实被单独分离并
| Parameter参数 | Unit†单位† | soil 1土壤1 | soil 2土壤2 | Biosolids生物固体 | soil 1 + biosolids土壤1 + 生物固体 | soil 2 + biosolids土壤2 + 生物固体 |
|---|---|---|---|---|---|---|
| pH | 4.9±0.0 | 8.8±0.1 | 4.3±0.0 | 4.3±0.0 | 5.2±0.1 | |
| EC | µS cm−1 | 97±3.2 | 24±1.3 | 2634±52 | 397±21 | 282±25 |
| C | % | 3.9±0.2 | 0.13±0.03 | 23±1.5 | 4.9±0.32 | 0.33±0.03 |
| N | % | 0.20±0.01 | <0.050 | 2.3±0.1 | 0.97±0.24 | 0.11±0.02 |
| NH4 +–N | 3.1±0.5 | <0.100 | 504±25 | 18±2.5 | 17±4.7 | |
| NO3 −–N | 23±3.4 | <0.100 | 634±57 | 87±26 | 35±7.6 | |
| S | T | 210±3.7 | 110±13 | 9010±200 | 830±102 | 550±47 |
| E | 32±51 | 32±50 | 1500±200 | 180±16 | 150±20 | |
| P | T | 370±6.9 | 480±36 | 5660±230 | 690±66 | 610±19 |
| Olsen P | 42±1.2 | 0.7±0.1 | 270±5.6 | 67±2.1 | 47±3.3 | |
| Ca | T (g kg−1) | 2.7±0.08 | 8.9±0.52 | 11±0.32 | 3.3±0.13 | 8.1±0.25 |
| K | T (g kg−1) | 4.7±0.06 | 3.9±0.22 | 3.8±0.05 | 4.5±0.13 | 4.1±0.17 |
| E | 98±50 | 150±110 | 160±20 | 99±10 | 49±10 | |
| Mg | T (g kg−1) | 4.1±0.05 | 6.4±0.17 | 3.9±0.09 | 4.4±0.10 | 6.4±0.19 |
| E | 140±40 | 120±12 | 230±13 | 160±13 | 82±13 | |
| Na | T | 220±4.3 | 240±12 | 400±14 | 240±11 | 220±18 |
| E | 25±7.8 | 41±4.3 | 110±9.1 | 49±4.9 | 29±4.7 | |
| Mn | T | 340±15 | 430±11 | 250±7.2 | 350±13 | 430±23 |
| E | 12±4 | 0.3±0.0 | 52±12 | 37±2.8 | 4.6±0.8 | |
| Zn | T | 69±1.6 | 50±1.1 | 1240±45 | 170±13 | 120±6.5 |
| E | 0.4±0.2 | 0.1±0.1 | 280±54 | 38±3.9 | 20±4.7 | |
| Cu | T | 3.0±0.2 | 11±1.5 | 610±16 | 42±8.9 | 43±4.0 |
| E | 0.04±0.06 | 0.01±0.01 | 3.0±2.2 | 0.18±0.02 | 0.15±0.04 | |
| Cd | T | 0.01±0.01 | <0.003 | 2.22±0.14 | 0.23±0.10 | 0.06±0.03 |
| E | 0.01±0.01 | <0.001 | 0.57±0.35 | 0.05±0.01 | 0.03±0.01 | |
| Pb | T | 15±0.8 | 14±0.4 | 120±4.3 | 21±4.4 | 17±0.5 |
| E | < 0.020 | <0.020 | 0.09±0.06 | <0.020 | <0.020 |
† Units are mg kg−1 dry weight unless otherwise indicated. T, pseudototal concentration; E, extractable concentration.
† 除另有说明外,单位均为mg kg−1干重。T,准全量浓度;E,可提取态浓度。
| species物种 | Family科 | Vernacular names俗名 | growth characteristics生长特性 |
|---|---|---|---|
| Monocots | |||
| Austroderia richardii(Endl.) N.P. Barker & H.P. Linder | Gramineae | Toetoe | Tussock (1 m), flower heads to 2–3 m |
| Cordyline australis(G. Forst.) Endl | Asparagaceae | Cabbage tree | Tree (5–12 m) |
| _Phormium cookianum_Le Jol. | Hemerocallidaceae | Mountain flax, wharariki | Tussock (60 cm), long flowers up to 1.5 m |
| _Phormium tenax_J.R. Forst. & G. Forst | Hemerocallidaceae | Flax, harareke | Tussock (2–3 m), flower stems up to 4–5 m tall |
| Dicots | |||
| _Coprosma robusta_Raoul | Rubiaceae | Karamū | Fast-growing shrub ~3 m tall |
| _Coprosma acerosa_A. Cunn. | Rubiaceae | Sand coprosma, tarakupenga | Low-growing prostrate or trailing shrub |
| _Myoporum laetum_G .Forst. | Scrophulariaceae | Ngaio | Shrub or small tree (2.5–9 m) |
| Olearia paniculata(J.R. Forst. & G. Forst.) Druce | Compositae | Akiraho, golden akeake | Bushy shrub or small tree (2.5–6 m) |
| Ozothamnus leptophyllus(G. Forst.) Breitw. & J.M. Ward | Compositae | Cottonwood, tauhinu | Many branched shrub (1.8 m) |
| _Pittosporum tenuifolium_Sol. ex Gaertn. | Pittosporaceae | Black matipo, kōhūhū | Small tree (4.6–9 m) |
| _Veronica salicifolia_G. Forst [syn.Hebe salicifolia(G. Forst.) Pennell†] | Plantaginaceae | Koromiko | Fast growing shrub (5 m) |
† Since this species is mostly known as Hebe salicifolia, we will use this name in the text.
† 由于该物种多以Hebe salicifolia为人所知,本文正文中采用此名称。
individually. Root weight was not included in this study because, in general, root biomass is highly correlated with shoot biomass. Only when there is a severe nutrient deficiency do root:shoot ratios change significantly (Hodge, 2009). Root chemical analyses were not included for this study, and we prioritized leaf analysis. Leaves are commonly used to study the nutrient status of plants, as well as the risk of trace elements entering the trophic networks, and so it is easier to compare with other results in the literature.
取样。本研究未包括根重,因为根生物量通常与地上部生物量高度相关,只有在严重缺乏养分时根冠比才会发生显著变化(Hodge, 2009)。本研究也未进行根系化学分析,而优先分析叶片。叶片常用于研究植物养分状况以及微量元素进入营养网络的风险,因此更便于与文献中的其他结果进行比较。
Samples were weighed and ground and passed through a 500-mm stainless-steel sieve. The rhizosphere soil (which is attached to the roots) was also collected to determine the dehydrogenase activity.
样品经称重、粉碎后过500 mm不锈钢筛。同时采集附着于根系的根际土壤,用于测定脱氢酶活性。
Chemical Analysis化学分析
Ammonia and nitrate concentration in soils, biosolids, and amended soils were determined in fresh samples, sieved through 2 mm at the beginning of the experiment. To determine NH4+ and NO3− concentrations, samples were extracted with KCl (Clough et al., 2001) and analyzed with a Flow Injection Analyzer (FOSS FIAstar 5000). The samples of soil, biosolids, and amended soils were later dried at room temperature and analyzed for pH in 1:2.5 soil-water ratio, electrical conductivity, pseudo-total concentration of elements (acid digestion in the microwave [CEM MARS Xpress] according to the equipment specifications), exchangeable concentration of elements [extraction with 0.05 M Ca(NO3)2; McLaren et al., 2005] by inductively coupled plasma optical emission spectroscopy (ICP–OES, Varian 720-ES), Olsen P (Olsen et al., 1954), and total C and N concentration with an Elementar Vario-Max CN Elemental Analyzer. Dehydrogenase activity (DHA) was analyzed in the fresh rhizosphere soil following the method described by Alef (1995).
试验开始时,取新鲜的土壤、生物固体和改良土壤样品过2 mm筛,测定其铵态氮和硝态氮浓度。测定NH4+和NO3−浓度时,样品用KCl浸提(Clough et al., 2001),并用流动注射分析仪(FOSS FIAstar 5000)分析。随后将土壤、生物固体和改良土壤样品室温风干,测定以下指标:pH(土水比1:2.5)、电导率、元素准全量浓度(按设备说明采用微波消解仪[CEM MARS Xpress]酸消解)、元素交换态浓度[0.05 M Ca(NO3)2浸提;McLaren et al., 2005](采用电感耦合等离子体发射光谱法测定,ICP–OES,Varian 720-ES)、Olsen P(Olsen et al., 1954),以及采用Elementar Vario-Max CN元素分析仪测定的全C和全N浓度。按照Alef(1995)所述方法测定新鲜根际土壤的脱氢酶活性(DHA)。
Plant material was analyzed for N and C using the CN Elemental analyzer. Mineral nutrients (P, K, Ca, Mg, and S) and trace elements (As, Cd, Cu, Pb, and Zn) were extracted by acid digestion the microwave CEM MARS Xpress according to the equipment specifications for plant extraction. Analysis of mineral nutrients and trace elements in the extracts of soil and plants were determined by the ICP–OES and expressed on a dry-weight basis.
植物样品的N和C采用CN元素分析仪测定。矿质养分(P、K、Ca、Mg和S)和微量元素(As、Cd、Cu、Pb和Zn)按设备针对植物消解的说明,采用CEM MARS Xpress微波消解仪酸消解提取。土壤和植物提取液中的矿质养分和微量元素采用ICP–OES测定,结果以干重计。
The microwave extraction method was assessed using a reference soil (reference 981, sandy soil from the Netherlands) and a reference plant sample (reference 952, mixture of grasses from the Netherlands) from Wageningen Evaluating Programs for Analytical Laboratories (WEPAL, NL-6700 EC Wageningen, the Netherlands). We obtained recoveries between 85 and 120%.
采用Wageningen分析实验室评价计划(WEPAL,NL-6700 EC Wageningen,荷兰)提供的参比土壤(参比物981,荷兰砂质土壤)和参比植物样品(参比物952,荷兰混合禾草)评估微波提取方法,回收率为85%~120%。
Statistical Analysis统计分析
Data of dry weight and element concentration in plants were compared in each species between the four treatments by ANOVA and post hoc multiple comparison testing (LSD test). When hypothesis of normality and homoscedasticity were not fulfilled, data were log transformed. Standardized data of dry weight and the foliar concentrations of N, S, P, Ca, Mg, Na, K, Mn, Zn, Cu, and Cd were analyzed using a principal component analysis (PCA). Averages of the PCA results in each species and treatment were calculated and represented in the figures. Statistics were performed using Statgraphics Centurion XVII.
采用ANOVA及事后多重比较检验(LSD检验)比较各物种在4个处理间植物干重和元素浓度的差异。当数据不满足正态性和方差齐性假设时,对数据进行对数转换。对干重及叶片N、S、P、Ca、Mg、Na、K、Mn、Zn、Cu和Cd浓度的标准化数据进行主成分分析(PCA)。计算各物种和处理PCA结果的平均值并绘于图中。统计分析采用Statgraphics Centurion XVII完成。
3Results and Discussion结果与讨论
Plant Growth植物生长
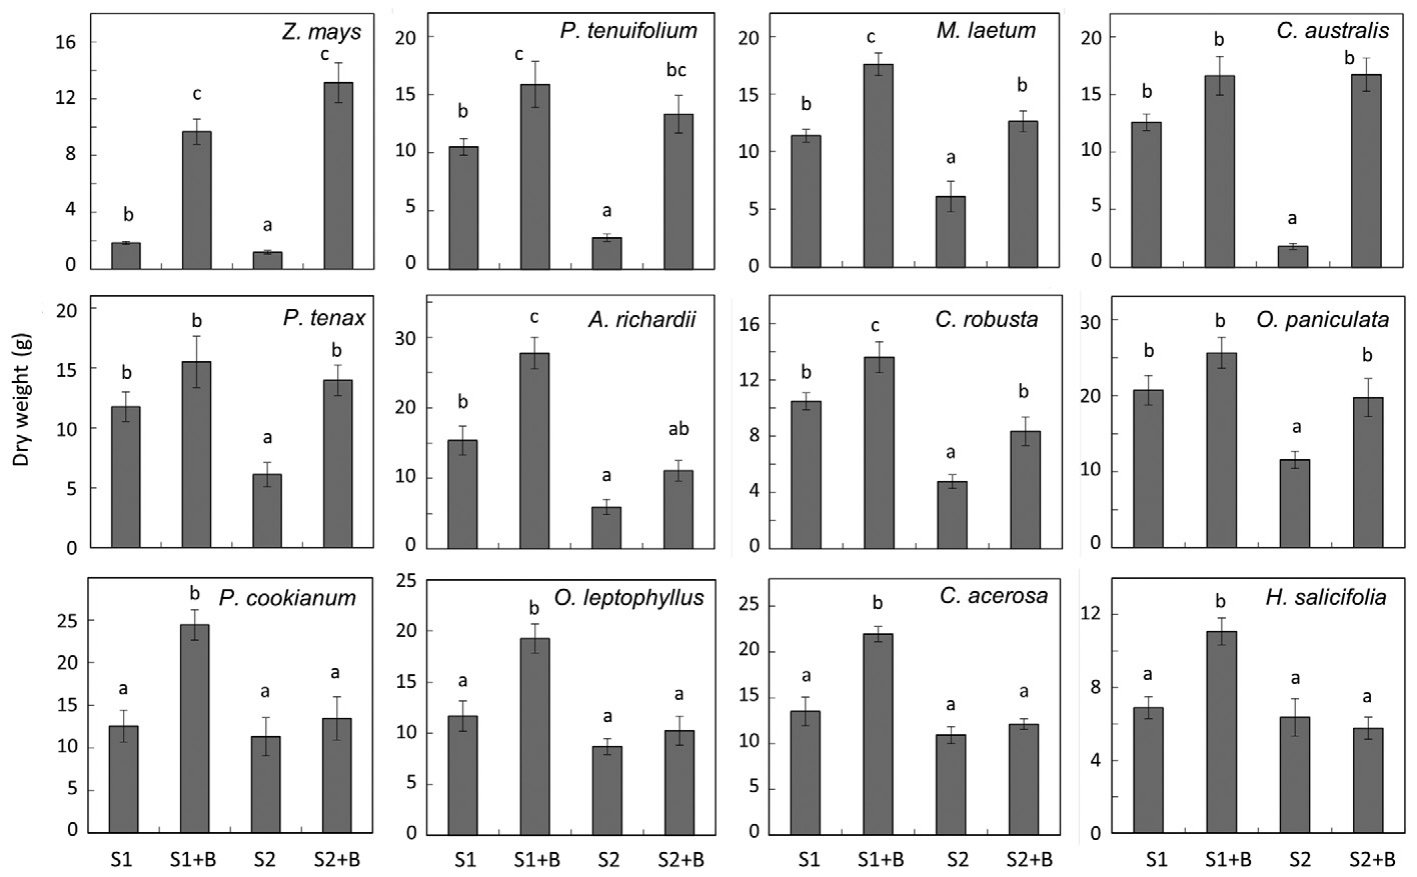
The growth of all plant species (measured as dry weight in the end of the experiment) increased in S1 amended with biosolids (Fig. 1). Compared with S1, the dry biomass increase in S1+B ranged from 25 (O. paniculata) to 95% (P. cookianum). None of the native species responded as well as Z. mays (500% increase), which may reflect the high nutrient requirements of this crop plant (Bozkurt et al., 2006) compared with the native species, which generally grow on poorer soils (Wardle, 1991).
添加生物固体后,S1中所有植物种类的生长量(以试验结束时的干重计)均有所增加(图1)。与S1相比,S1+B中干生物量的增幅为25%(O. paniculata)至95%(P. cookianum)。所有本土物种的响应均不及Z. mays(增幅500%),这可能反映出该作物的养分需求较高(Bozkurt et al., 2006),而本土物种通常生长于较贫瘠的土壤中(Wardle, 1991)。
Given that the percentage increase in OM and nutrients was higher in S2 than S1 (Table 1) after biosolids addition, we would expect a greater plant growth response in this soil than in S1. In the case of P. tenuifolium, M. laetum, C. australis, P. tenax, C. robusta, and O. paniculata, as well as our reference species Z. mays, the percentage increase in biomass in the S2+B compared with the S2 was significantly greater than the corresponding increase when biosolids were added to S1. However, in contrast with our hypothesis, there was no significant increase in the biomass of P. cookianum, O. leptophyllus, C. acerosa, and H. salicifolia.
鉴于添加生物固体后S2中OM和养分的增幅百分比高于S1(表1),可以预期该土壤中植物生长的响应大于S1。对于P. tenuifolium、M. laetum、C. australis、P. tenax、C. robusta和O. paniculata以及参照物种Z. mays,S2+B相对于S2的生物量增幅显著大于S1添加生物固体后的相应增幅。然而,与我们的假设相反,P. cookianum、O. leptophyllus、C. acerosa和H. salicifolia的生物量未显著增加。
For these species, the dramatic pH decrease and salinity increase caused by the biosolids addition (Table 1) could have negatively counteracted the positive effect caused by the nutrient addition.
对这些物种而言,添加生物固体引起的pH急剧下降和盐度升高(表1)可能抵消了养分添加带来的正面效应。
Whereas Dickinson et al. (2015) reported negligible biomass increases for native plants grown in biosolids-amended soil, our study showed that most species responded positively to biosolids addition, but that this response was soil dependent. In our experiment, the only species in common with those used by Dickinson et al. (2015) was P. tenax. In our study, P. tenax responded positively to biosolids in both S1 and S2, underlining the importance of soil type on the plant response to biosolids.
Dickinson et al.(2015)报道,本土植物在生物固体改良土壤中生物量增加可以忽略,而本研究表明,大多数物种对添加生物固体呈正向响应,但这种响应取决于土壤类型。本试验中,与Dickinson et al.(2015)所用物种相同的仅有P. tenax。本研究中,P. tenax在S1和S2中均对生物固体表现出正向响应,这突出了土壤类型对植物响应生物固体的重要影响。
Many authors (Moreno-Peñaranda et al., 2004; Walter and Calvo, 2009) have shown that the plant communities established on degraded soils using biosolids are distinct from the communities that would spontaneously occur if biosolids were not added. The competition between species is also different when biosolids are added, and sometimes the better competitors in such remediated areas are not the desired species for the remediation (Borden and Black, 2011). In our study, the exotic Z. mays was the fastest growing plant in the S1+B and S2+B treatments. According to Borden and Black (2011), biosolids addition could increase the growth of exotic species, many of which are more adapted to high-fertility environments than the native species, which may lead to increased problems with weeds in sites restored using biosolids. Native species that usually show positive interactions (ecological facilitation) could become competitors when the nutrient status in soils is improved (Liu et al., 2013). These findings suggest that further research with assemblages of native plants in field conditions is needed to evaluate community dynamics in restoration with biosolids.
许多学者(Moreno-Peñaranda et al., 2004; Walter and Calvo, 2009)已证明,利用生物固体在退化土壤上建立的植物群落,不同于未添加生物固体时自然形成的群落。添加生物固体后,物种间的竞争关系也会发生变化,有时此类修复区域中竞争力较强的物种并非修复所期望的物种(Borden and Black, 2011)。本研究中,外来物种Z. mays在S1+B和S2+B处理中生长最快。根据Borden and Black(2011),添加生物固体可能促进外来物种的生长,其中许多外来物种比本土物种更适应高肥力环境,这可能导致利用生物固体恢复的场地杂草问题加剧。当土壤养分状况改善时,通常表现为正相互作用(生态促进作用)的本土物种可能转变为竞争者(Liu et al., 2013)。上述结果表明,需要在田间条件下对本土植物组合开展进一步研究,以评估生物固体恢复过程中的群落动态。
Plant Nutrition植物营养
Tables 3 and 4 show the elemental concentrations of plant leaves. The concentrations of N, S, and P in plant species were in most of the cases below the normal values for plants (1–5, 0.1–0.5, and 0.3–0.5% for N, S, and P respectively) reported by Marschner (2012) when they grew in soils without amendment. However, these values increased significantly in all plant species when biosolids were added to the two soil types, reaching values similar to those reported by Dickinson et al. (2015). Those authors studied the nutritional status of 11 NZ native species grown in the same nursery where the plants of this study come from and others collected from two areas with different degrees of habitat alteration. Their results indicate that there are limiting nutrients in both soils, which are supplemented by biosolids addition. Nitrogen, P, and S were significantly higher in the biosolids treatment (Table 1). The concentrations of these nutrients in Z. mays leaves were lower or similar in S1+B than in S1 (Table 3). This could be caused by a dilution effect, due to the small size of control plants. When the total uptake is calculated (data not shown), the N, P, and S mass extracted is significantly higher in S1+B than in S1. In S2, the concentration of these nutrients is higher with the application of biosolids. Even in biosolids-amended soils, the nutrient concentration does not reach the values reported by Bozkurt et al. (2006), who grew corn in up to 38 Mg hm−2 biosolids-amended soil. Nitrogen and P concentrations in biosolids used by Bozkurt et al. (2006) were similar to the concentrations of those nutrients in the biosolids that we used in our study.
表3和表4列出了植物叶片的元素浓度。在未改良土壤中生长时,大多数情况下植物的N、S和P浓度低于Marschner(2012)报道的植物正常值(N、S和P分别为1%~5%、0.1%~0.5%和0.3%~0.5%)。然而,两种土壤添加生物固体后,所有植物种类的上述浓度均显著增加,达到与Dickinson et al.(2015)报道相近的水平。这些作者研究了11种新西兰本土物种的营养状况,这些植物来自本研究植物所在的同一苗圃,以及两个生境改变程度不同的区域。其结果表明,两种土壤中均存在限制性养分,而添加生物固体可补充这些养分。生物固体处理中N、P和S显著较高(表1)。Z. mays叶片中这些养分的浓度在S1+B中低于或近似于S1(表3),这可能是由于对照植株个体较小而产生的稀释效应。计算总吸收量(数据未列出)时,S1+B中N、P和S的提取量显著高于S1。在S2中,施用生物固体后这些养分的浓度更高。即使在生物固体改良土壤中,养分浓度也未达到Bozkurt et al.(2006)报道的水平,该研究在施用高达38 Mg hm−2生物固体的改良土壤中种植玉米。Bozkurt et al.(2006)所用生物固体中的N和P浓度与本研究所用生物固体中的浓度相近。
| treatment处理 | n | s | P | Mn | Zn | Cu | Cd |
|---|---|---|---|---|---|---|---|
| % | — g kg | −1— | ——— | —— mg | kg−1—— | ——— | |
| Zea mays | |||||||
| S1 | 3.1 d | 1.6 c | 1.1 b | 240 c | 50 b | 6.2 c | 0.00 a |
| S1+B | 1.8 c | 1.6 c | 1.1 ab | 230 c | 310 d | 5.0 b | 0.17 c |
| S2 | 0.64 a | 0.70 a | 0.95 a | 30 a | 20 a | 3.7 a | 0.00 a |
| S2+B | 1.1 b | 1.3 b | 1.1 ab | 100 b | 150 c | 4.6 b | 0.10 b |
| Austroderia | richardii | ||||||
| S1 | 0.79 a | 0.97 a | 0.78 a | 170 b | 10 a | 2.3 a | 0.00 a |
| S1+B | 0.59 a | 1.2 a | 1.5 b | 280 c | 140 b | 3.5 b | 0.11 b |
| S2 | 0.75 a | 1.3 a | 0.90 a | 30 a | 20 a | 2.8 ab | 0.01 a |
| S2+B | 1.4 b | 2.0 b | 1.8 b | 50 a | 160 b | 5.6 c | 0.07 ab |
| Cordyline au | stralis | ||||||
| S1 | 0.65 a | 0.81 ab | 1.2 a | 390 c | 40 a | 5.6 ab | 0.04 a |
| S1+B | 0.83 a | 1.1 bc | 1.9 bc | 580 d | 340 c | 5.6 ab | 1.03 c |
| S2 | 0.77 a | 1.1 a | 1.8 ab | 50 a | 46 a | 6.3 a | 0.15 a |
| S2+B | 0.84 a | 1.5 c | 2.3 c | 110 b | 250 b | 7.1 b | 0.69 b |
| Phormium c | ookianu | m | |||||
| S1 | 1.0 b | 0.86 ab | 1.1 ab | 160 b | 30 b | 2.6 ab | 0.00 a |
| S1+B | 1.1 b | 1.0 b | 1.6 b | 300 c | 140 d | 4.2 c | 0.62 b |
| S2 | 0.53 a | 0.52 a | 0.92 a | 80 a | 20 a | 1.1 a | 0.00 a |
| S2+B | 1.1 b | 1.1 b | 1.4 ab | 120 ab | 40 c | 2.9 bc | 0.15 a |
| Phormium t | enax | ||||||
| S1 | 0.98 b | 0.82 a | 1.3 b | 210 b | 40 a | 2.7 b | 0.05 a |
| S1+B | 1.3 c | 1.2 b | 2.0 c | 330 c | 270 c | 4.6 c | 0.65 b |
| S2 | 0.55 a | 0.58 a | 0.84 a | 90 a | 40 a | 1.2 a | 0.01 a |
| S2+B | 1.3 c | 1.2 b | 2.3 c | 90 a | 110 b | 4.4 c | 0.12 a |
Calcium, K, Mg, and Na concentrations in plants were dependent on species, soil type, and element (see the Supplemental Material for detailed results of chemical analysis). Concentrations of Ca, K, Mg, and Na in both soils were unaffected by the addition of biosolids (Table 1); therefore, the changes in concentration of these elements is due more to general nutrient requirements and nutrient ratios of each species (Marschner, 2012) than to the addition of biosolids.
植物中Ca、K、Mg和Na的浓度取决于物种、土壤类型和元素(化学分析的详细结果见补充材料)。两种土壤中Ca、K、Mg和Na的浓度均未受添加生物固体的影响(表1);因此,这些元素浓度的变化更多地取决于各物种的一般养分需求和养分比例(Marschner, 2012),而非生物固体的添加。
| treatmen处理 | t n | s | P | Mn | Zn | Cu | Cd |
|---|---|---|---|---|---|---|---|
| % | — g k | g−1— | ——— | —— mg | kg−1—— | ——— | |
| Coprosma | _acerosa_le | aves | |||||
| S1 | 1.3 b | 1.4 b | 1.3 a | 780 b | 80 a | 3.4 a | 0.07 a |
| S1+B | 1.6 c | 2.6 c | 2.0 b | 1120 c | 430 c | 5.9 b | 1.53 b |
| S2 | 0.84 a | 0.75 a | 0.86 a | 240 a | 70 a | 1.7 a | 0.05 a |
| S2+B | 1.6 c | 2.4 c | 1.7 b | 260 a | 170 b | 5.3 b | 0.61 b |
| Coprosma | _acerosa_fr | uits | |||||
| S1 | 1.2 a | 1.1 a | 2.0 a | 190 c | 50 a | 4.9 a | 0.07 ab |
| S1+B | 1.4 a | 1.3 b | 2.3 a | 200 c | 110 c | 5.6 a | 0.60 c |
| S2 | 1.4 a | 1.1 ab | 2.2 a | 50 a | 50 a | 5.0 a | 0.05 a |
| S2+B | 1.4 a | 1.7 c | 2.3 a | 70 b | 60 b | 6.1 a | 0.14 b |
| Coprosma | robusta | ||||||
| S1 | 1.3 b | 1.2 b | 0.99 a | 340 c | 50 a | 2.4 a | 0.06 a |
| S1+B | 1.7 c | 2.2 d | 1.8 c | 590 d | 490 c | 6.3 c | 1.63 c |
| S2 | 0.88 a | 0.93 a | 0.91 a | 80 a | 40 a | 1.9 a | 0.17 ab |
| S2+B | 1.3 b | 1.61 c | 1.4 b | 160 b | 140 b | 4.7 b | 0.36 b |
| Myoporu | m laetum | ||||||
| S1 | 1.0 b | 2.2 a | 0.90 a | 160 b | 20 a | 4.6 a | 0.00 a |
| S1+B | 1.4 d | 3.6 b | 1.8 b | 310 c | 370 c | 16 b | 0.34 b |
| S2 | 0.75 a | 2.4 a | 0.96 a | 80 a | 30 a | 4.0 a | 0.01 a |
| S2+B | 1.2 c | 4.1 b | 1.9 b | 130 b | 130 b | 15.1 b | 0.20 b |
| Olearia p | aniculata | ||||||
| S1 | 0.79 b | 0.59 b | 0.87 a | 140 b | 20 a | 3.0 b | 0.01 a |
| S1+B | 1.1 c | 0.96 c | 1.2 bc | 280 c | 280 c | 11 c | 0.44 b |
| S2 | 0.49 a | 0.40 a | 0.92 ab | 60 a | 20 a | 1.5 a | 0.08 a |
| S2+B | 1.2 c | 1.0 c | 1.3 c | 60 a | 70 b | 8.5 c | 0.09 a |
| Ozotham | nus leptoph | yllus | |||||
| S1 | 1.3 b | 1.2 b | 1.3 a | 390 b | 40 a | 4.2 a | 0.04 a |
| S1+B | 1.5 b | 1.9 c | 2.5 b | 790 c | 320 c | 12.5 b | 0.53 c |
| S2 | 0.68 a | 0.64 a | 1.2 a | 190 a | 30 a | 2.0 a | 0.06 a |
| S2+B | 1.2 b | 2.8 d | 1.5 a | 260 ab | 90 b | 5.4 a | 0.18 b |
| Pittosporu | m tenuifoli | um | |||||
| S1 | 0.92 b | 0.98 a | 1.1 b | 890 c | 70 b | 3.0 b | 0.05 a |
| S1+B | 1.0 b | 1.3 b | 1.9 c | 780 c | 1010 d | 4.2 c | 2.15 c |
| S2 | 0.55 a | 0.86 a | 0.72 a | 50 a | 30 a | 1.0 a | 0.00 a |
| S2+B | 1.4 c | 1.5 c | 1.9 c | 180 b | 610 c | 5.4 d | 0.82 b |
| Hebe salic | ifolia | ||||||
| S1 | 1.3 b | 1.5 a | 1.1 a | 210 a | 10 a | 1.5 b | 0.00 a |
| S1+B | 1.8 c | 3.2 c | 2.0 b | 460 b | 280 c | 7.8 d | 1.12 c |
| S2 | 0.67 a | 1.1 a | 1.2 a | 180 a | 10 a | 0.8 a | 0.00 a |
| S2+B | 1.5 bc | 2.3 b | 2.1 b | 210 a | 80 b | 4.9 c | 0.37 b |
Trace Elements微量元素
The Cu concentrations in leaves of C. robusta, C. acerosa, P. tenuifolium, P. tenax, P. cookianum, O. paniculata, and H. salicifolia growing in S1 and S2 were <2 mg kg−1, which is the Cu concentration required by most plants for normal growth (Marschner, 2012). Concentrations increased to the normal levels reported by Marschner (2012) and Dickinson et al. (2015) in the S1+B and S2+B. Only O. paniculata grown in biosolids-amended soils had higher Cu concentration than in natural habitats (Dickinson et al., 2015). These concentration increases are consistent with the increase in extractable Cu in the biosolids-amended soils (Table 1).
生长于S1和S2中的C. robusta、C. acerosa、P. tenuifolium、P. tenax、P. cookianum、O. paniculata和H. salicifolia叶片中Cu浓度 <2 mg kg−1,即大多数植物正常生长所需的Cu浓度(Marschner, 2012)。在S1+B和S2+B中,其浓度升高至Marschner(2012)和Dickinson et al.(2015)报道的正常水平。仅有生长于生物固体改良土壤中的O. paniculata的Cu浓度高于其自然生境中的水平(Dickinson et al., 2015)。上述浓度的升高与生物固体改良土壤中可提取态Cu的增加相一致(表1)。
In all cases, plants in the biosolids treatment had significantly higher foliar Zn concentrations than the controls. As with Cu, this increase in foliar Zn follows an increase in the extractable Zn in soil (Table 1). The Zn concentrations in O. paniculata, A. richardii, M. laetum, P. cookianum, and H. salicifolia growing in nonamended soils were <20 mg kg−1, a range considered by Marschner (2012) to be deficient. However, in the biosolids treatments, the Zn concentration increased to levels higher than those found for the same species in nursery and natural habitats (Dickinson et al., 2015), even levels that may be toxic for plants (>100 mg kg−1; Chaney, 1989) or for livestock (>300 mg kg−1; Chaney, 1989).
在所有情况下,生物固体处理中植物叶片Zn浓度均显著高于对照。与Cu相似,叶片Zn的增加伴随着土壤可提取态Zn的增加(表1)。生长于未改良土壤中的O. paniculata、A. richardii、M. laetum、P. cookianum和H. salicifolia的Zn浓度 <20 mg kg−1,Marschner(2012)认为该范围属于缺乏水平。然而,在生物固体处理中,Zn浓度升高至高于同一物种在苗圃和自然生境中的水平(Dickinson et al., 2015),甚至达到可能对植物(>100 mg kg−1;Chaney, 1989)或家畜(>300 mg kg−1;Chaney, 1989)产生毒害的水平。
Although biosolids slightly increased Cd total and extractable concentration in soils (Table 1), many of the plant species in our experiment accumulated this element at high rates. This concentration did not reach toxic levels for plants (>5 mg kg−1; Chaney, 1989) in any species. However, P. tenuifolium, C. robusta, P. cookianum, O. leptophyllus, and C. acerosa in leaves and fruits and H. salicifolia, C. australis, and P. tenax growing in biosolids-amended soil reached Cd concentrations that exceeded the safe levels for livestock (0.5 mg kg−1; Chaney, 1989). In accordance with Hahner et al. (2014) and Dickinson et al. (2015), P. tenuifolium and C. robusta are the species with the highest Cd concentration in leaves.
尽管生物固体仅使土壤中Cd的全量和可提取态浓度略有增加(表1),但本试验中许多植物种类对该元素的积累量较高。所有物种中该浓度均未达到对植物的毒害水平(>5 mg kg−1;Chaney, 1989)。然而,生长于生物固体改良土壤中的P. tenuifolium、C. robusta、P. cookianum、O. leptophyllus和C. acerosa的叶片和果实,以及H. salicifolia、C. australis和P. tenax,其Cd浓度超过了家畜安全水平(0.5 mg kg−1;Chaney, 1989)。与Hahner et al.(2014)和Dickinson et al.(2015)的结果一致,P. tenuifolium和C. robusta是叶片Cd浓度最高的物种。
Although Mn total concentration in biosolids-amended soils was similar to that in nonamended soils, the exchangeable fraction increased by biosolids addition (Table 1). The Mn concentration was higher in aerial parts of most of the species growing in biosolids-amended soils. Six species grown in S1+B reach values that could be considered phytotoxic (>400 mg kg−1; Chaney, 1989). Coprosma acerosa even could be a problem for livestock.
尽管生物固体改良土壤中Mn全量浓度与未改良土壤相近,但添加生物固体使其交换态组分增加(表1)。生长于生物固体改良土壤中的大多数物种地上部Mn浓度较高。在S1+B中生长的6个物种Mn浓度达到可视为植物毒害的水平(>400 mg kg−1;Chaney, 1989)。Coprosma acerosa甚至可能对家畜构成问题。
The behavior of Z. mays regarding trace element concentration was not very different from that of the native species. The Cu concentration was in the normal range for plants, according to Marschner (2012), and similar to the values reported by other authors who grew corn in biosolids-amended soils (Granato et al., 2004). The Mn was higher in the treatments with biosolids, but values did not reach the toxic levels for plants or livestock. Zinc and Cd concentrations increased significantly in the treatments with biosolids in both soils. The Cd concentration of 0.2 mg kg−1 is lower than that considered to be toxic for plants (>5 mg kg−1; Chaney, 1989) or livestock (0.5 mg kg−1; Chaney, 1989). However, Zn in S1+B (310 mg kg−1) may be toxic for plants (>100 mg kg−1; Chaney, 1989) or livestock (>300 mg kg−1; Chaney, 1989).
就微量元素浓度而言,Z. mays的表现与本土物种差异不大。根据Marschner(2012),其Cu浓度处于植物正常范围内,且与其他在生物固体改良土壤中种植玉米的学者所报道的数值相近(Granato et al., 2004)。生物固体处理中Mn较高,但未达到对植物或家畜的毒害水平。两种土壤中,生物固体处理的Zn和Cd浓度均显著升高。0.2 mg kg−1的Cd浓度低于对植物(>5 mg kg−1;Chaney, 1989)或家畜(0.5 mg kg−1;Chaney, 1989)的毒害水平。然而,S1+B中的Zn(310 mg kg−1)可能对植物(>100 mg kg−1;Chaney, 1989)或家畜(>300 mg kg−1;Chaney, 1989)产生毒害。
However, plants did not show toxicity symptoms. Other authors have not reported signs of toxicity when corn accumulated high Zn concentrations due to biosolids addition (Jarausch- Wehrheim et al., 1999; Granato et al., 2004), even at higher rates than the one we chose for this experiment.
然而,植物并未表现出毒害症状。其他学者在玉米因添加生物固体而积累高浓度Zn时也未报道毒害迹象(Jarausch- Wehrheim et al., 1999; Granato et al., 2004),即使其施用量高于本试验所选用的施用量。
Trace element concentration in the shoots can limit the use of these plants amended with high doses of biosolids for restoration of degraded areas. In this experiment, biosolids acidified the soil (especially S2), thereby increasing the solubility of cations. Biosolids also added OM, which can reduce cation mobility. These two effects are element dependent. However, other studies (Madejón et al., 2006; Ciadamidaro et al., 2015) have shown that Cd uptake in the field in biosolids-amended soil is often lower than in pot trials.
地上部微量元素浓度可能限制在高剂量生物固体改良条件下利用这些植物恢复退化区域。本试验中,生物固体使土壤酸化(尤其是S2),从而提高了阳离子的溶解度。生物固体还添加了OM,而OM可降低阳离子的迁移性。这两种效应因元素而异。然而,其他研究(Madejón et al., 2006; Ciadamidaro et al., 2015)表明,田间生物固体改良土壤中的Cd吸收量通常低于盆栽试验。
Principal Component Analysis主成分分析
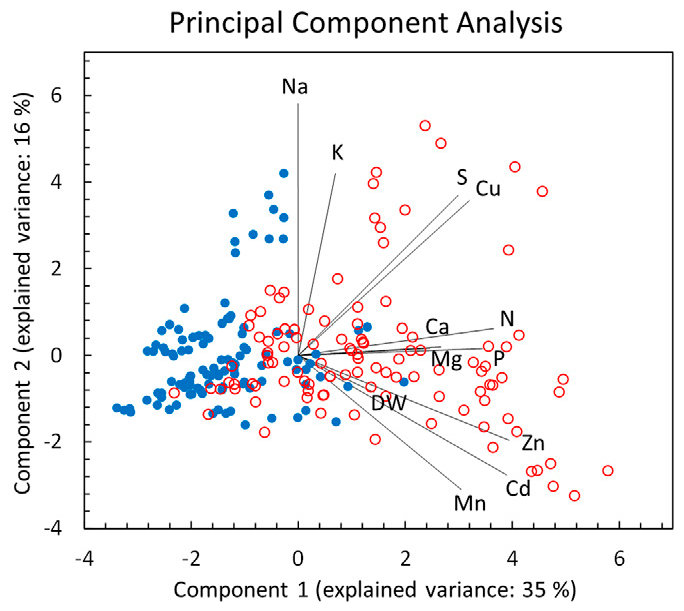
The general response of plants to biosolids addition in both soils was investigated by a PCA, which included the dry weight and elemental composition of all NZ-native plant species (Fig. 2). Zea mays was omitted from the analysis because there was a large difference in its response to biosolids, which masked differences between the native species. The first component separated the points without biosolids from those with biosolids addition. The variables with the highest weight in this component were Zn, Cd, Mn, P, N, and Cu, followed by S, Ca, and Mg. The second component differentiated the points depending on the Na concentration, followed by the K, S, and Cu concentrations in the positive part of the axis, and the Mn, Cd, and Zn concentrations in the negative part of the axis. This second component was more related to differences in species behavior than biosolids addition. Although salinity of biosolids was high and they produce and increase in soil salinity when added (Table 1), the Na concentration in plants did not change with biosolids addition. Dry weight of plants was a low-weight variable in both components.
通过PCA考察了两种土壤中植物对添加生物固体的总体响应,分析包括所有新西兰本土植物种类的干重和元素组成(图2)。由于Zea mays对生物固体的响应差异很大,会掩盖本土物种之间的差异,故未纳入分析。第一主成分将未添加生物固体的样点与添加生物固体的样点区分开来。该主成分中权重最高的变量为Zn、Cd、Mn、P、N和Cu,其次为S、Ca和Mg。第二主成分依据Na浓度区分样点,其次是轴正半部分的K、S和Cu浓度,以及轴负半部分的Mn、Cd和Zn浓度。第二主成分更多地与物种行为差异相关,而非与添加生物固体相关。尽管生物固体盐度较高,添加后会导致土壤盐度升高(表1),但植物中Na浓度并未随生物固体的添加而变化。植物干重在两个主成分中均为低权重变量。
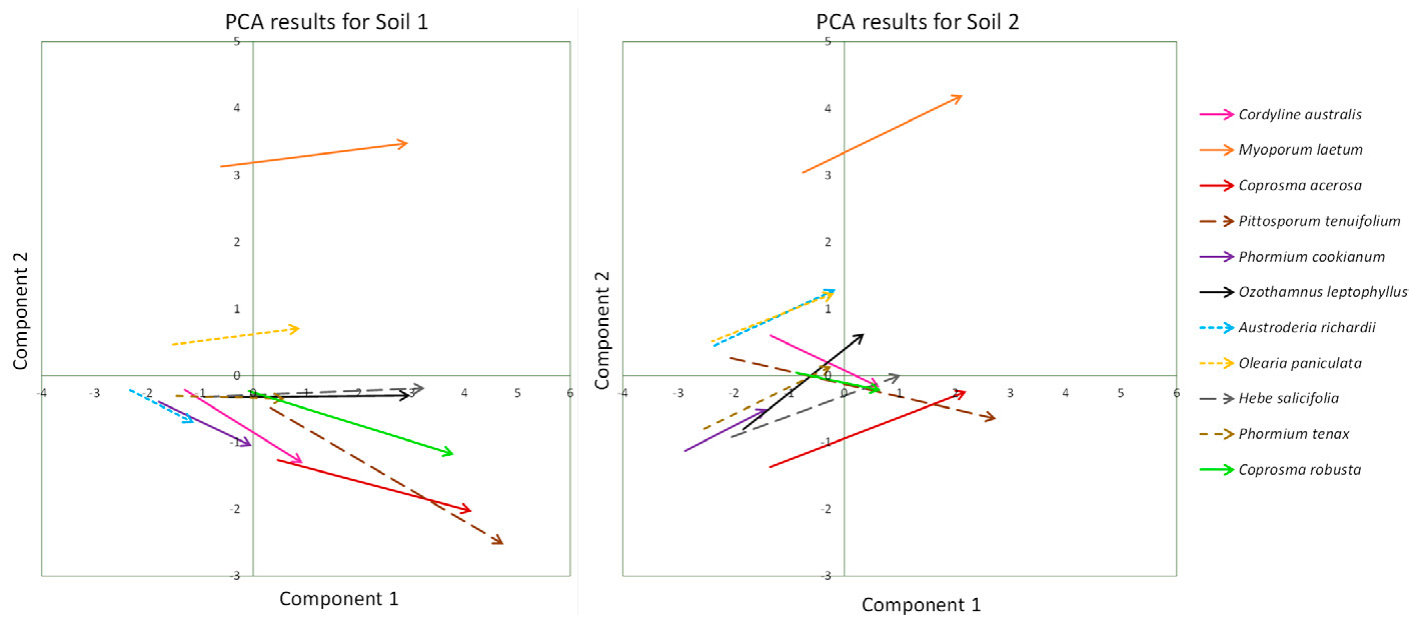
The behavior of plant species is represented according to their average PCA values in both soils (Fig. 3). Each arrow represents a single species. The arrows indicate the change from the average PCA value in the treatment without biosolids to the average PCA value in the treatment with biosolids. The PCA shows that all species in both soils significantly increase in Component 1 when biosolids were added to soils. This indicates that all species increase their concentration of macronutrients such as N, P, and S and trace elements Mn, Zn, Cd, and Cu when biosolids were added, even those species that did not show great differences in biomass production due to the biosolids addition in S2. In accordance with Hahner et al. (2014), the native monocots show a pattern of lower concentration of nutrients than the dicots in S1 (Fig. 3). This difference was more pronounced in plants growing in biosolids-amended soil and was consistent with a higher nutrient requirement in dicots. If this is the case, then dicots may outperform monocots in native plant communities that are amended with biosolids.
根据各植物种类在两种土壤中的PCA平均值表示其行为(图3),每个箭头代表一个物种。箭头表示从未添加生物固体处理的PCA平均值到添加生物固体处理的PCA平均值的变化。PCA结果表明,两种土壤添加生物固体后,所有物种在主成分1上均显著增加。这表明添加生物固体后,所有物种体内N、P、S等大量营养元素以及Mn、Zn、Cd和Cu等微量元素的浓度均有所增加,即使是在S2中添加生物固体后生物量未见显著差异的物种也是如此。与Hahner et al.(2014)一致,在S1中本土单子叶植物的养分浓度总体低于双子叶植物(图3)。这一差异在生物固体改良土壤中生长的植物中更为明显,与双子叶植物养分需求较高相符。若确实如此,则在施用生物固体改良的本土植物群落中,双子叶植物可能比单子叶植物更具优势。
The contrasting behavior of the species in each soil is shown in Component 2 (Fig. 3). This component separates species depending on their Na and K concentration (e.g., M. laetum, which was the species with the highest concentration of those nutrients). It also separates species depending on their response to biosolids addition, according to the relationship between Mn, Zn, and Cd increase and S and Cu increase. Figure 3 shows that the response of plants to biosolids addition was more species dependent in S2 than in S1.
主成分2显示了各物种在不同土壤中的不同表现(图3)。该主成分依据Na和K浓度区分物种(如M. laetum,其为上述养分浓度最高的物种)。它还根据Mn、Zn和Cd增加量与S和Cu增加量之间的关系,依据物种对添加生物固体的响应将其区分开来。图3表明,植物对添加生物固体的响应在S2中比在S1中更依赖于物种。
The species with the highest differences in Component 2 in S1 compared with S1+B are P. tenuifolium, C. robusta, C. acerosa, and C. australis, followed by A. richardii and P. cookianum. In S2, C. robusta, P. tenuifolium, and Cordyline australis are more related to the negative part of Axis 2, meaning higher increase in dry weight and Mn, Zn, and Cd concentrations. The rest of species present an increase in Component 2 values in S2+B compared with S2, meaning higher Cu, K, and S concentrations compared with trace elements. This indicates which species concentrate the elements Mn, Zn, and Cd when biosolids are added in each soil type.
与S1+B相比,S1中主成分2差异最大的物种为P. tenuifolium、C. robusta、C. acerosa和C. australis,其次为A. richardii和P. cookianum。在S2中,C. robusta、P. tenuifolium和Cordyline australis与轴2负半部分关系更密切,意味着其干重以及Mn、Zn和Cd浓度增幅更大。其余物种在S2+B中的主成分2值较S2有所增加,意味着相对于微量元素而言,其Cu、K和S浓度更高。这表明了在各土壤类型中添加生物固体后哪些物种会富集Mn、Zn和Cd。
Dehydrogenase Activity脱氢酶活性
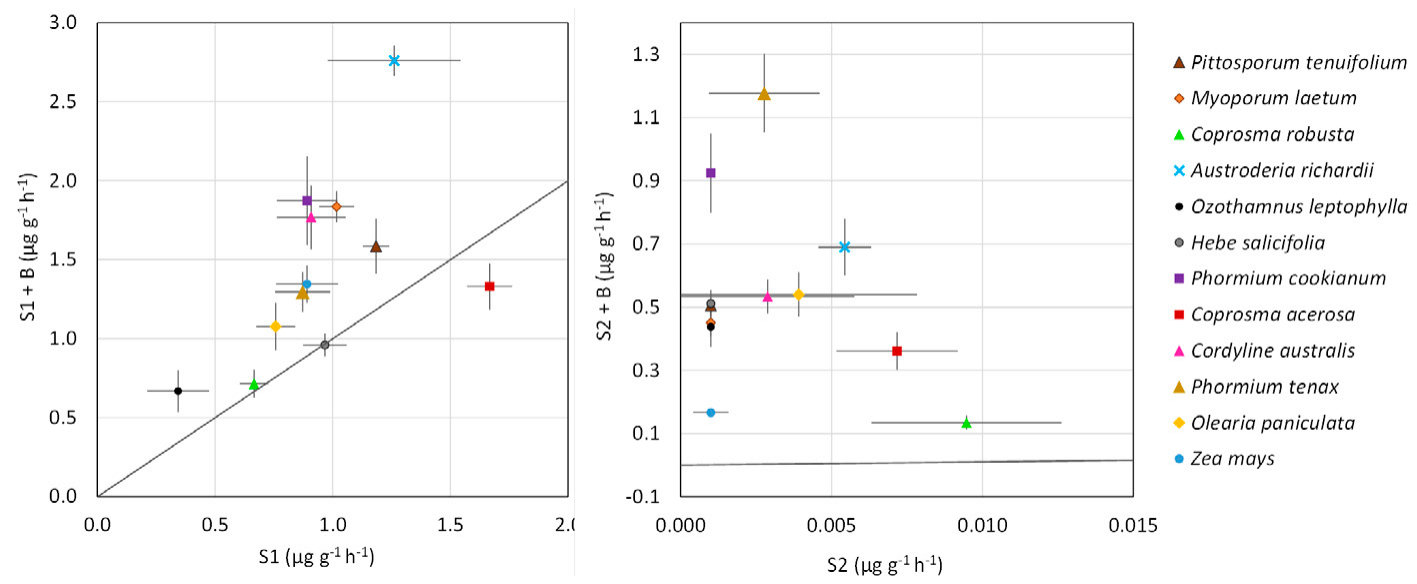
Dehydrogenase activity is frequently used as a general measure of viable microorganisms in degraded soils (Gil-Sotres et al., 2005). Figure 4 shows the effect of the biosolids on values of DHA in the rhizospheres of the different species in both soils. In S1, biosolids improved microbial activity in the rhizosphere of all the species (except for C. acerosa). In S2, the activity in the rhizosphere of all the species without amendment was almost null (Fig. 4), demonstrating the poor microbiological state of the original soil. Biosolids addition to this soil increased DHA to levels approaching S1. Many authors have shown the positive effect of biosolids on this activity in degraded soils (Pérez de Mora et al., 2005). Trace elements in the biosolids may be toxic to the soil biota (Obbard, 2001) and thereby offset the positive effects of the root system and OM addition (Pérez de Mora et al., 2005).
脱氢酶活性常被用作退化土壤中活性微生物的总体指标(Gil-Sotres et al., 2005)。图4显示了生物固体对两种土壤中不同物种根际DHA值的影响。在S1中,生物固体提高了所有物种(C. acerosa除外)根际的微生物活性。在S2中,未改良时所有物种根际的活性几乎为零(图4),表明原土壤微生物状况较差。向该土壤添加生物固体后,DHA提高至接近S1的水平。许多学者已证明生物固体对退化土壤中该酶活性的积极作用(Pérez de Mora et al., 2005)。生物固体中的微量元素可能对土壤生物区系产生毒害(Obbard, 2001),从而抵消根系和OM添加带来的积极效应(Pérez de Mora et al., 2005)。
4Conclusions结论
All NZ-native species tested benefited, in either growth or nutrient status, from biosolids addition to low-fertility soil. The growth responses were soil dependent, with 4 of the 11 species showing no increased growth rate in one of the biosolids-amended soils. The addition of biosolids into degraded soil could improve and accelerate the growth and establishment of the native plants tested. In the cases of P. tenuifolium and C. australis, the use of biosolids (or other fertilizer) would be a basic requirement if these species were to be planted in very low-fertility soils. Although most native species showed a positive response to biosolids, the response of Z. mays, a nutrient-demanding crop plant, was much greater. Using biosolids for ecological restoration may exacerbate problems with exotic weeds or even change relationships between native species. Field trials are required to investigate this, as well as the long-term consequences of applying biosolids to NZ-native vegetation. In particular, the concentrations of Cd in certain species (P. tenuifolium and C. robusta) should be monitored because these species may facilitate the entry of this toxic element into the food chain. In the case of using the biosolids described in this research, lower rates of application would be desired to decrease the risk of accumulating trace elements in leaves of native plants.
向低肥力土壤添加生物固体后,所有供试新西兰本土物种在生长或养分状况方面均受益。生长响应取决于土壤类型,11个物种中有4个在其中一种生物固体改良土壤中生长速率未见提高。向退化土壤添加生物固体可改善并加速供试本土植物的生长和建植。对于P. tenuifolium和C. australis,若要在极低肥力土壤中种植,施用生物固体(或其他肥料)将是基本条件。尽管大多数本土物种对生物固体呈正向响应,但需肥作物Z. mays的响应要大得多。利用生物固体进行生态恢复可能加剧外来杂草问题,甚至改变本土物种之间的关系。需要开展田间试验研究这一问题,以及向新西兰本土植被施用生物固体的长期后果。尤其应监测某些物种(P. tenuifolium和C. robusta)中的Cd浓度,因为这些物种可能促使这一有毒元素进入食物链。若使用本研究所述的生物固体,宜采用较低的施用量,以降低本土植物叶片中微量元素积累的风险。
5Acknowledgments致谢
We gratefully acknowledge the Centre for Integrated Biowaste Research for funding of this study. Dr. MJ Gutiérrez-Ginés held a fellowship granted by Fundación Ramón Areces. Dr. E. Madejón thanks the financial support for her work at Lincoln University, New Zealand, from Program Salvador de Madariaga of the Spanish MECD.
感谢Centre for Integrated Biowaste Research对本研究的资助。MJ Gutiérrez-Ginés博士获得Fundación Ramón Areces奖学金资助。E. Madejón博士感谢西班牙MECD的Salvador de Madariaga项目为其在新西兰林肯大学的工作提供资助。
6References参考文献
Alef, K. 1995. Dehydrogenase activity. In: K. Alef and P. Nannipieri, editors, Methods in applied soil microbiology and biochemistry. Academic Press, London. p. 228–231.
ANZBP. 2016. New Zealand biosolids statistics. Aust. and N. Z. Biosolids Partnership, Aust. Water Assoc. http://www.biosolids.com.au/bs-nz.php (accessed 1 July 2016).
Borden, R.K., and R. Black. 2011. Biosolids application and long-term noxious weed dominance in the western United States. Restor. Ecol. 19:639–647. doi:10.1111/j.1526-100X.2010.00671.x
Bozkurt, M.A., H. Akdeniz, B. Keskin, and I.H. Yilmaz. 2006. Possibilities of using sewage sludge as nitrogen fertilizer for maize. Acta Agric. Scand., Sect. B 56:143–149. doi:10.1080/0906471051003113
Bradley, J. 2008. New Zealand. In: R.J. LeBlanc, P. Matthews, and R.P. Richard, editors, Global atlas of excreta, wastewater sludge, and biosolids management: Moving forward the sustainable and welcome uses of a global resource. UN Human Settlements Prog., UN-HABITAT, Nairobi, Kenya. p. 447–454.
Bradshaw, A.D. 1984. Ecological principles and land reclamation practice. Landscape Planning 11:35–48. doi:10.1016/0304-3924(84)90016-9
Bremer, L.L., and K.A. Farley. 2010. Does plantation forestry restore biodiversity or create green deserts? A synthesis of the effects of land-use transitions on plant species richness. Biodivers. Conserv. 19:3893–3915. doi:10.1007/ s10531-010-9936-4
Chaney, R.L. 1989. Toxic element accumulation in soils and crops: Protecting soil fertility and agricultural food-chains. In: B. Bar-Yosef, N.J. Barrow, and J. Goldshmid, editors, Inorganic contaminants in the vadose zone. Springer-Verlag, Berlin. p. 140–158. doi:10.1007/978-3-642-74451-8_10
Chazdon, R.L. 2008. Beyond deforestation: Restoring forests and ecosystem services on degraded lands. Science 320:1458–1460. doi:10.1126/science.1155365
Ciadamidaro, L., M. Puschenreiter, J. Santner, W.W. Wenzel, P. Madejón, and E. Madejón. 2015. Assessment of trace element phytoavailability in compost amended soils using different methodologies. J. Soils Sediments 17:1251– 261. doi:10.1007/s11368-015-1283-3
Clough, T.J., R.J. Stevens, R.J. Laughlin, R.R. Sherlock, and K.C. Cameron. 2001. Transformations of inorganic-N in soil leachate under differing storage conditions. Soil Biol. Biochem. 33:1473–1480. doi:10.1016/ S0038-0717(01)00056-6
Crowe, A. 1997. A field guide to the native edible plants of New Zealand. Godwit Publishing, Auckland, New Zealand.
Dickinson, N., M. Marmiroli, B. Das, D. McLaughlin, D. Leung, and B. Robinson. 2015. Endemic plants as browse crops in agricultural landscapes of New Zealand. Agroecol. Sustain. Food Syst. 39:224–242. doi:10.1080/21 683565.2014.967438
DOC. 2005. Native plant communities of the Canterbury Plains. Dep. of Conservation, Christchurch, New Zealand.
Ecroyd, C.E., and E.G. Brockerhoff. 2005. Floristic changes over 30 years in a Canterbury Plains kānuka forest remnant, and comparison with adjacent vegetation types. N. Z. J. Ecol. 29:279–290.
Franklin, H.M., N.M. Dickinson, C.J.D. Esnault, and B.H. Robinson. 2015. Native plants and nitrogen in agricultural landscapes of New Zealand. Plant Soil 394:407–420. doi:10.1007/s11104-015-2622-2
Funk, J.L., E.E. Cleland, K.N. Suding, and E.S. Zavaleta. 2008. Restoration through reassembly: Plant traits and invasion resistance. Trends Ecol. Evol. 23:695–703. doi:10.1016/j.tree.2008.07.013
Gartler, J., B. Robinson, K. Burton, and L. Clucas. 2013. Carbonaceous soil amendments to biofortify crop plants with zinc. Sci. Total Environ. 465:308–313. doi:10.1016/j.scitotenv.2012.10.027 Gibbs, H.K., and J.M. Salmon. 2015. Mapping the world’s degraded lands. Appl. Geogr. 57:12–21. doi:10.1016/j.apgeog.2014.11.024. Gil-Sotres, F., C. Trasar-Cepeda, M.C. Leirós, and S. Seoane. 2005. Different approaches to evaluating soil quality using biochemical properties. Soil Biol. Biochem. 37:877–887. doi:10.1016/j.soilbio.2004.10.003
Granato, T.C., R.I. Pietz, G.J. Knafl, C.R. Carlson, P. Tata, and C. Lue-Hing. 2004. Trace element concentrations in soil, corn leaves, and grain after cessation of biosolids applications. J. Environ. Qual. 33:2078–2089. doi:10.2134/jeq2004.2078
Hahner, J.L., B.H. Robinson, Z. Hong-Tao, and N.M. Dickinson. 2014. The phytoremediation potential of native plants on New Zealand dairy farms. Int. J. Phytorem. 16:719–734. doi:10.1080/15226514.2013.856845 Hewitt, A.E. 2010. New Zealand soil classification. 3rd ed. Manaaki Whenua Press, Lincoln, New Zealand.
Hodge, A. 2009. Root decisions. Plant Cell Environ. 32:628–640. doi:10.1111/j.1365-3040.2008.01891.x
James, J., and R. Harrison. 2016. The effect of harvest on forest soil carbon: A meta-analysis. Forests 7:308. doi:10.3390/f7120308
Jarausch-Wehrheim, B., B. Mocquot, and M. Mench. 1999. Absorption and translocation of sludge-borne zinc in field-grown maize (Zea mays L.). Eur. J. Agron. 11:23–33. doi:10.1016/S1161-0301(99)00016-7
Jurgensen, M.F., A.E. Harvey, R.T. Graham, D.S. Page-Dumroese, J.R. Tonn, M.J. Larsen, and T.B. Jain. 1997. Impacts of timber harvesting on soil organic matter, nitrogen, productivity, and health of Inland Northwest forests. For. Sci. 43:234–251.
Kelty, M.J. 2006. The role of species mixtures in plantation forestry. For. Ecol. Manage. 233:195–204. doi:10.1016/j.foreco.2006.05.011
Liu, N., H. Ren, S. Yuan, Q. Guo, and L. Yang. 2013. Testing the stress-gradient hypothesis during the restoration of tropical degraded land using the shrub rhodomyrtus tomentosa as a nurse plant. Restor. Ecol. 21:578–584. doi:10.1111/j.1526-100X.2012.00937.x
Madejón, E., A.P. De Mora, E. Felipe, P. Burgos, and F. Cabrera. 2006. Soil amendments reduce trace element solubility in a contaminated soil and allow regrowth of natural vegetation. Environ. Pollut. 139:40–52. doi:10.1016/j.envpol.2005.04.034
Madejón, P., T. Marañón, J.M. Murillo, and B. Robinson. 2004. White poplar (Populus alba) as a biomonitor of trace elements in contaminated riparian forests. Environ. Pollut. 132:145–155. doi:10.1016/j.envpol.2004.03.015
Marschner, P. 2012. Marschner’s mineral nutrition of higher plants. 3rd ed. Elsevier, London.
McLaren, R.G., L.M. Clucas, M.D. Taylor, and T. Hendry. 2005. Leaching of macronutrients and metals from undisturbed soils treated with metalspiked sewage sludge. 3. Distribution of residual metals. Aust. J. Soil Res. 43:159–170. doi:10.1071/SR04109
Metcalf, L.J. 1991. The cultivation of New Zealand trees and shrubs. Reed, Auckland, New Zealand.
Meurk, C.D. 2008. Vegetation of the Canterbury plains and downlands. In: N. Winterbourn, G. Knox, C. Burrows, and I. Marsden, editors, The natural history of Canterbury. Canterbury Univ. Press, Christchurch, New Zealand. p. 195–250.
Meyer, V.F., E.F. Redente, K.A. Barbarick, R.B. Brobst, M.W. Paschke, and A.L. Miller. 2004. Plant and soil responses to biosolids application following forest fire. J. Environ. Qual. 33:873–881. doi:10.2134/jeq2004.0873
Montiel-Rozas, M.M., E. Madejón, and P. Madejón. 2015. Evaluation of phytostabilizer ability of three ruderal plants in mining soils restored by application of organic amendments. Ecol. Eng. 83:431–436. doi:10.1016/j. ecoleng.2015.04.096.
Moreno-Peñaranda, R., F. Lloret, and J.M. Alcañiz. 2004. Effects of sewage sludge on plant community composition in restored limestone quarries. Restor. Ecol. 12:290–296. doi:10.1111/j.1061-2971.2004.00310.x
Newman, R.F., M. Krzic, and B.M. Wallace. 2014. Differing effects of biosolids on native plants in grasslands of southern British Columbia. J. Environ. Qual. 43:1672–1678. doi:10.2134/jeq2014.01.0013
Obbard, J.P. 2001. Measurement of dehydrogenase activity using 2-p-iodophenyl-3-p-nitrophenyl-5-phenyltetrazolium chloride (INT) in the presence of copper. Biol. Fertil. Soils 33:328–330. doi:10.1007/s003740000332 Olsen, S.R., C. V. Cole, F.S. Watanabe, and L.A. Dean. 1954. Estimation of available phosphorous in soils by extraction with sodium bicarbonate. USDA Circ. 939. U. S. Gov. Print. Office, Washington, DC.
Pérez de Mora, A., J. Ortega-Calvo, F. Cabrera, and E. Madejón. 2005. Changes in enzyme activities and microbial biomass after “in situ” remediation of a heavy metal-contaminated soil. Appl. Soil Ecol. 28:125–137. doi:10.1016/j.apsoil.2004.07.006
Salmon, J.T. 1991. Native New Zealand flowering plants. Reed, Auckland, New Zealand.
Singh, R.P., and M. Agrawal. 2008. Potential benefits and risks of land application of sewage sludge. Waste Manag. 28:347–358. doi:10.1016/j. wasman.2006.12.010 Sopper, W.E., and L.T. Kardos, editors. 1973. Recycling treated municipal wastewater and sludge through forest and cropland. The Pennsylvania State Univ. Press, University Park, PA.
Walter, I., and R. Calvo. 2009. Biomass production and development of native vegetation following biowaste amendment of a degraded, semi-arid soil. Arid Land Res. Manage. 23:297–310. doi:10.1080/15324980903231827
Wang, H., M.O. Kimberley, and P.J. Wilks. 2013. Economic analysis of a pine plantation receiving repeated applications of biosolids. PLoS One 8:e57705. doi:10.1371/journal.pone.0057705 Wang, H., G.N. Magesan, M.O. Kimberley, T.W. Payn, P.J. Wilks, and C.R. Fisher. 2004. Environmental and nutritional responses of a Pinus radiata plantation to biosolids application. Plant Soil 267:255–262. doi:10.1007/ s11104-005-0107-4
Wardle, P. 1991. Vegetation of New Zealand. The Blackburn Press, Caldwell, NJ. Xue, J., M.O. Kimberley, C. Ross, G. Gielen, L.A. Tremblay, O. Champeau et al. 2015. Ecological impacts of long-term application of biosolids to a radiata pine plantation. Sci. Total Environ. 530–531:233–240. doi:10.1016/j. scitotenv.2015.05.096