Contents lists available at ScienceDirect journal homepage: www.elsevier.com/locate/chemosphere
a School of Physical and Chemical Sciences, University of Canterbury, New Zealand b Department of Soil and Physical Sciences, Lincoln University, New Zealand
h i g h l i g h t s
� Gallium and indium are more strongly bound to soil than other common trace element contaminants.
• 与其他常见微量元素污染物相比,镓和铟与土壤的结合更为牢固。
� Gallium and indium are poorly translocated into the aerial portions of Lolium perenne.
• 镓和铟向 Lolium perenne 地上部分的转运能力较弱。
� Gallium and indium are likely to accumulate in soil.
• 镓和铟很可能在土壤中累积。
� Soil ingestion is the most likely exposure pathway for humans and animals.
• 摄入土壤是人类和动物最可能的暴露途径。
a r t i c l e i n f o
a b s t r a c t
1Introduction引言
Gallium (Ga) and indium (In) are chalcophilic metallic trace elements that are non-essential for life. (Połedniok et al., 2012; Ladenberger et al., 2015). Crustal concentrations of Ga and In average 15e19 mg kg�1 and 0.05e0.07 mg kg�1, respectively, and their respective topsoil concentrations range between 3 and 300 mg kg�1, and 0.01e0.5 mg kg�1 (Kabata-Pendias and Mukherjee, 2007; Połedniok et al., 2012; Lokanc et al., 2015).
镓(Ga)和铟(In)是亲硫性金属微量元素,对生命活动并非必需(Połedniok et al., 2012; Ladenberger et al., 2015)。Ga和In在地壳中的平均含量分别为15–19 mg kg−1和0.05–0.07 mg kg−1,其在表层土壤中的含量范围分别为3–300 mg kg−1和0.01–0.5 mg kg−1(Kabata-Pendias and Mukherjee, 2007; Połedniok et al., 2012; Lokanc et al., 2015)。
* Corresponding author.
E-mail address: brett.robinson@canterbury.ac.nz (B.H. Robinson).
Both elements are used extensively in electronic equipment. Gallium arsenide (GaAs) and gallium nitride (GaN) semiconductors are used in wireless and optoelectronic applications (Butcher and Brown, 2014). Indium-tin oxide (ITO) is used as a coating on liquid crystal displays, plasma displays and touch screens (Schwarz-Schampera, 2014). From 1995 to 2015, Ga production increased from 62 to 469 tonnes and In 239e769 tonnes (U.S. Geological Survey, 2017a; b). Both elements could enter the environment through the manufacture or disposal of electronic equipment (Robinson, 2009; Maneesuwannarat et al., 2016). Environmental contamination associated with e-waste is less of an issue in developed countries compared to developing countries (Robinson, 2009). Oguchi et al. (2011) reported that Ga is increasingly used in electronic equipment, which indicates that it will be present in e-waste. Similarly, Chen et al. (2015) reported that industrial sludge associated with electronic manufacturing contained 40e42 mg kg�1 In. Up to 4.6 mg kg�1 In was present in soil surrounding recycling sites in Indian slums (Ha et al., 2009), and up to 2.8 mg kg�1 In near a site in Ghana (Tokumaru et al., 2017).
这两种元素均广泛应用于电子设备。砷化镓(GaAs)和氮化镓(GaN)半导体用于无线通信和光电领域(Butcher and Brown, 2014)。铟锡氧化物(ITO)用作液晶显示器、等离子显示器和触摸屏的涂层(Schwarz-Schampera, 2014)。1995—2015年间,Ga产量由62 t增至469 t,In产量由239 t增至769 t(U.S. Geological Survey, 2017a; b)。这两种元素均可能通过电子设备的制造或废弃处置进入环境(Robinson, 2009; Maneesuwannarat et al., 2016)。与发展中国家相比,发达国家与电子废弃物相关的环境污染问题较轻(Robinson, 2009)。Oguchi et al.(2011)报道,Ga在电子设备中的使用日益增多,表明电子废弃物中将含有Ga。同样,Chen et al.(2015)报道,电子制造相关的工业污泥中In含量为40–42 mg kg−1。印度贫民窟回收场地周边土壤中In含量高达4.6 mg kg−1(Ha et al., 2009),加纳某场地附近土壤中In含量高达2.8 mg kg−1(Tokumaru et al., 2017)。
https://doi.org/10.1016/j.chemosphere.2018.06.111 0045-6535/© 2018 Published by Elsevier Ltd.
https://doi.org/10.1016/j.chemosphere.2018.06.111 0045-6535/© 2018 Published by Elsevier Ltd.
Neither Ga nor In are mined in isolation, but are produced as a by-product during the processing of other metals (Schwarz- Schampera, 2014; Lu et al., 2017). Ha et al. (2011) and Boughriet et al. (2007) measured up to 97 and 75 mg kg�1 In, respectively, in soil surrounding a Pb-Zn mine and a smelter. Others reported lower concentrations of 1.6 mg kg�1 (Waterlot et al., 2013), 1.4 mg kg�1 (Li et al., 2016), 0.55 mg kg�1 (Sterckeman et al., 2002) and 0.37 mg kg�1 (Aide, 2009). Połedniok et al. (2012) reported soil Ga concentrations at five sites near mines or metal processing plants ranging 93e441 mg kg�1 Ga and nearby agricultural soils contained 39e219 mg kg�1 Ga. Coal is a major source of Ga, which is further concentrated in fly ash (Lu et al., 2017). Qin et al. (2015) found 100e263 mg kg�1 Ga in coal from China and the Former Soviet Union, while Font et al. (2007) and Fang and Gesser (1996) reported found fly ash concentrations of 37.5e320 mg kg�1 at power plants in Spain, Canada, China and Israel. Biosolids may become a significant source if they are contaminated with industrial waste (Sharma et al., 2017). Zhang et al. (2002) reported Japanese biosolids contained 91e339 mg kg�1 Ga, and studies in Sweden reported biosolids concentrations of 1e41 mg kg�1 (Eriksson, 2001; Ahlberg et al., 2006).
Ga和In均无单独开采,而是作为其他金属加工过程中的副产品生产(Schwarz-Schampera, 2014; Lu et al., 2017)。Ha et al.(2011)和Boughriet et al.(2007)分别在某Pb-Zn矿和某冶炼厂周边土壤中测得In含量高达97和75 mg kg−1。其他研究报道的含量较低,分别为1.6 mg kg−1(Waterlot et al., 2013)、1.4 mg kg−1(Li et al., 2016)、0.55 mg kg−1(Sterckeman et al., 2002)和0.37 mg kg−1(Aide, 2009)。Połedniok et al.(2012)报道,矿山或金属加工厂附近5个场地的土壤Ga含量为93–441 mg kg−1,附近农业土壤Ga含量为39–219 mg kg−1。煤是Ga的主要来源,Ga在粉煤灰中进一步富集(Lu et al., 2017)。Qin et al.(2015)在产自中国和前苏联的煤中测得Ga含量为100–263 mg kg−1,而Font et al.(2007)以及Fang and Gesser(1996)报道西班牙、加拿大、中国和以色列发电厂粉煤灰中Ga含量为37.5–320 mg kg−1。若生物固体(污泥)受到工业废物污染,则可能成为重要来源(Sharma et al., 2017)。Zhang et al.(2002)报道日本生物固体中Ga含量为91–339 mg kg−1,瑞典的研究报道生物固体中Ga含量为1–41 mg kg−1(Eriksson, 2001; Ahlberg et al., 2006)。
Gallium and In have the potential to adversely affect animal health if they enter the food chain, though little is currently known of their toxicity thresholds and effects. Large increases of any element from background concentrations may negatively affect animal health through a variety of exposure pathways (White and Hemond, 2012). While there are data for acute and chronic human and animal exposure to In and Ga (Homma et al., 2003; Kjølholt et al., 2003; Ivanoff et al., 2012; Ayadi et al., 2014), there are currently no food and drinking water safety limits.
若Ga和In进入食物链,可能对动物健康产生不利影响,但目前对其毒性阈值和效应知之甚少。任何元素含量相对背景值的大幅升高,都可能通过多种暴露途径对动物健康造成负面影响(White and Hemond, 2012)。尽管已有关于人类和动物急性及慢性暴露于In和Ga的数据(Homma et al., 2003; Kjølholt et al., 2003; Ivanoff et al., 2012; Ayadi et al., 2014),但目前尚无食品和饮用水安全限值。
While the speciation of Ga and In may vary according to their use, when released into the environment they are likely to revert to the +3 oxidation state and their behaviour in soil is likely dominated by the stability of their respective aqueous trivalent species, ion hydrolysis and hydroxide precipitation (Wood and Samson, 2006). The octahedral hydrated cations Ga3þ and In3þ are acidic, and upon hydrolysis form the aqueous species Ga/In(OH)2þ, Ga/ In(OH)2+, Ga/In(OH)30 and Ga/In(OH)4- , depending on the pH of the surrounding solution (Bernstein, 1998). However, their ionic potentials drive key differences between the three, such as the pH range at which hydrolysis occurs (Kabata-Pendias and Mukherjee, 2007). The hydroxide forms Ga(OH)4- and In(OH)3 are the dominant species in most agricultural soils, with pHs of 5.5e7.0 (McLaren and Cameron, 1996; Wood and Samson, 2006; Desutter and Godsey, 2010). Neutral forms of Ga and In are poorly soluble and rapidly precipitate, with this process peaking when these species’ concentrations are the highest (Ga at pH 4.3e5.2, In at pH 6.0e8.0), and dissociation to ionic forms outside of that range causing dramatic variation. The solubility of a-GaOOH (a crystalline compound) was modelled to range from 10�9.3-10�4 M at pH 3e10 in pure water at 25 �C, and an equally large range of 10�7.3-10�4 M has been reported for amorphous In(OH)3 (Wood and Samson, 2006). Transformation of Ga/In(OH)3 to a-GaOOH, b-Ga2O3, In analogues and other mineral forms occurs from aging, heat and/or pressure (Pokrovski et al., 1997; Bernstein, 1998). Due to their high ionic potentials of 48 nm�1 for Ga3þ and 38 nm�1 for In3þ (Shannon, 1976), both elements likely bond with hard inorganic ligands such as F�, PO43�, and SO42�; softer In also bonds strongly with Cl� (Wood and Samson, 2006). Both elements are frequently complexed by organic acids, such as citric, malic and acetic, released in soil by root exudation (Jaitz et al., 2011; Boros et al., 2014; Chang et al., 2017). Although their aqueous oxidation state is always +3 (Wood and Samson, 2006), movement may be influenced by reduction and oxidation of Mn, Fe and S, whose redoxactive solid phases can serve as sites at which sorption and mineral formation occurs (Kabata-Pendias and Mukherjee, 2007; Połedniok et al., 2012).
尽管Ga和In的形态可能因用途而异,但释放到环境后很可能恢复为+3氧化态,其在土壤中的行为很可能主要受各自水相三价物种的稳定性、离子水解和氢氧化物沉淀控制(Wood and Samson, 2006)。八面体水合阳离子Ga3+和In3+呈酸性,水解后根据周围溶液pH的不同形成水相物种Ga/In(OH)2+、Ga/In(OH)2+、Ga/In(OH)30和Ga/In(OH)4-(Bernstein, 1998)。然而,二者的离子势导致了关键差异,例如发生水解的pH范围不同(Kabata-Pendias and Mukherjee, 2007)。在pH为5.5–7.0的大多数农业土壤中,氢氧化物形态Ga(OH)4-和In(OH)3为优势物种(McLaren and Cameron, 1996; Wood and Samson, 2006; Desutter and Godsey, 2010)。Ga和In的中性形态溶解度低且迅速沉淀,该过程在这些物种浓度最高时达到峰值(Ga在pH 4.3–5.2,In在pH 6.0–8.0),而在此范围之外解离为离子形态则导致显著变化。模拟结果表明,25 °C纯水中α-GaOOH(一种晶态化合物)在pH 3–10范围内的溶解度为10−9.3–10−4 M,无定形In(OH)3的溶解度同样具有10−7.3–10−4 M的较大范围(Wood and Samson, 2006)。Ga/In(OH)3在老化、加热和/或加压作用下转化为α-GaOOH、β-Ga2O3、相应的In类似物及其他矿物形态(Pokrovski et al., 1997; Bernstein, 1998)。由于Ga3+和In3+的离子势较高,分别为48 nm−1和38 nm−1(Shannon, 1976),两种元素很可能与F−、PO43−和SO42−等硬无机配体结合;较软的In还能与Cl−强烈结合(Wood and Samson, 2006)。两种元素常与根系分泌释放到土壤中的有机酸(如柠檬酸、苹果酸和乙酸)络合(Jaitz et al., 2011; Boros et al., 2014; Chang et al., 2017)。尽管二者在水相中的氧化态始终为+3(Wood and Samson, 2006),但其迁移可能受Mn、Fe和S还原与氧化的影响,这些元素的氧化还原活性固相可作为吸附和矿物形成的位点(Kabata-Pendias and Mukherjee, 2007; Połedniok et al., 2012)。
As precipitation and adsorption cause solubility to be low, soil contaminants are likely readily immobilised and rendered unavailable to organisms, although there are reports that as little as 67% of In was sorbed in many soils (Hou et al., 2005; Boughriet et al., 2007; Waterlot et al., 2013) and just 55e85% of Ga was sorbed in (Połedniok et al., 2012). However (Sheppard et al., 2007), reported that KD values (solid/solution concentration coefficients) of Ga and In in Canadian soils were 11,000 and 2800 respectively.
由于沉淀和吸附作用导致溶解度较低,土壤污染物很可能易被固定而无法被生物利用,但也有报道指出,在许多土壤中In的吸附比例低至67%(Hou et al., 2005; Boughriet et al., 2007; Waterlot et al., 2013),Ga的吸附比例仅为55%–85%(Połedniok et al., 2012)。然而,Sheppard et al.(2007)报道加拿大土壤中Ga和In的KD值(固相/溶液浓度系数)分别为11,000和2800。
There is limited information on plant uptake of Ga and In. Gallium concentrations of <0.001 mg kg�1 were reported in wheat and barley grains (Eriksson, 2001) in five Swedish arable soils containing <9 mg kg�1 Ga. A selection of edible mushrooms contained 1.4e6.6 mg kg�1 Ga (Dursun et al., 2006). Leersia hexandra and Houttuynia cordata in Vietnam contained 0.36e2.57 mg kg�1 Ga (Ha et al., 2011). Higher concentrations have been obtained under hydroponic conditions with 2 mg kg�1 and 74 mg kg�1 found in wheat and rice (Wheeler and Power, 1995; Syu et al., 2017). Indium concentrations were <0.005 mg kg�1 in wheat and barley (Eriksson, 2001), and <0.05 in perennial ryegrass (Waterlot et al., 2013). Cabbage, garlic and water spinach contained 0.001e0.005 mg kg�1 In (Li et al., 2016), while Vietnamese vegetables contained 0.14e3.89 mg kg�1 (Ha et al., 2011), with up to 151 mg kg�1 in rice growing near a metal recycling centre with unquantified, but probably elevated, soil Ga concentrations. Most Ga and In accumulate in the roots with shoot: root ratios of 0.028 and 0.11 Ga in barley and wheat (Wheeler and Power, 1995; Omberg et al., 2011), 0.082e0.22 Ga in Arabidopsis thaliana (Chang et al., 2017), and <0.32 of both elements in rice (Yu et al., 2015; Syu et al., 2017). Gallium and In may behave similarly to Al, which is retained in the epidermis and outer cortex of the roots (Eticha et al., 2005; Horst et al., 2010; Mauseth, 2014). Kopittke et al. (2009) reported that Ga reduced elongation in cowpea roots through strong cellular binding. Therefore, we would hypothesise that only limited amounts of Ga and In are likely to be transported from soil to shoot biomass.
关于植物吸收Ga和In的信息十分有限。在5种Ga含量<9 mg kg−1的瑞典耕作土壤上,小麦和大麦籽粒中Ga含量<0.001 mg kg−1(Eriksson, 2001)。部分食用菌Ga含量为1.4–6.6 mg kg−1(Dursun et al., 2006)。越南的Leersia hexandra和Houttuynia cordata中Ga含量为0.36–2.57 mg kg−1(Ha et al., 2011)。水培条件下获得的含量更高,小麦和水稻中分别为2 mg kg−1和74 mg kg−1(Wheeler and Power, 1995; Syu et al., 2017)。小麦和大麦中In含量<0.005 mg kg−1(Eriksson, 2001),多年生黑麦草中<0.05(Waterlot et al., 2013)。卷心菜、大蒜和空心菜中In含量为0.001–0.005 mg kg−1(Li et al., 2016),而越南蔬菜中为0.14–3.89 mg kg−1(Ha et al., 2011),生长于某金属回收中心附近的水稻中高达151 mg kg−1,该处土壤Ga含量未定量,但很可能偏高。大部分Ga和In累积于根部,大麦和小麦中Ga的地上部:根比值为0.028和0.11(Wheeler and Power, 1995; Omberg et al., 2011),Arabidopsis thaliana中Ga为0.082–0.22(Chang et al., 2017),水稻中两种元素均<0.32(Yu et al., 2015; Syu et al., 2017)。Ga和In的行为可能与Al相似,后者滞留于根表皮和外皮层(Eticha et al., 2005; Horst et al., 2010; Mauseth, 2014)。Kopittke et al.(2009)报道,Ga通过强烈的细胞结合作用抑制豇豆根系伸长。因此,我们假设仅有有限量的Ga和In可能从土壤转运至地上部生物量。
The aim of this study was to determine the mobility of Ga and In in the soil e plant system, and evaluate their potential to enter into the food chain. Batch sorption experiments were used to measure the partitioning of the metals between the soil solid and solution phases; pot trials were employed to estimate capacity for uptake and translocation by perennial ryegrass (Lolium perenne L., the most common pastoral species in many pasturelands); and aqueous speciation modelling was completed with Visual MINTEQ 3.1.
本研究旨在确定Ga和In在土壤–植物系统中的迁移性,并评估其进入食物链的潜力。采用批量吸附试验测定金属在土壤固相与溶液相之间的分配;采用盆栽试验估算多年生黑麦草(Lolium perenne L.,许多牧场中最常见的牧草物种)的吸收和转运能力;并利用Visual MINTEQ 3.1完成水相形态模拟。
2Materials and methods材料与方法
2.1. Soil properties2.1. 土壤性质
A high fertility vegetable-growing mottled/typic orthic granular silt loam (Landcare Research, 2018) was collected near Pukekohe, New Zealand (37�13018.9200S 174�5205.9400E), during summer 2012/ 13. The physical and chemical properties of the soil were measured in two previous studies (Valentinuzzi et al., 2015; Al Mamun et al., 2016) and are presented in Table 1. The pH of the soil was adjusted approximately 4 years before this work by mixing the soil thoroughly with laboratory grade lime (CaCO3) in the following proportions: 0.3, 0.6, 1.3 or 10 wt%, resulting in soil pH (1:2.5 mass soil: vol. H2O) values of 5.5, 6.0, 6.8, 7.0 and 7.1 respectively (Valentinuzzi et al., 2015).
于2012/13年夏季在新西兰Pukekohe附近(37°13′18.92″S 174°52′5.94″E)采集一种高肥力蔬菜种植用斑纹/典型正常粒状粉砂壤土(Landcare Research, 2018)。该土壤的理化性质已在前期两项研究中测定(Valentinuzzi et al., 2015; Al Mamun et al., 2016),见表1。约在本研究4年前,将土壤与实验室级石灰(CaCO3)按0.3、0.6、1.3或10 wt%的比例充分混合以调节土壤pH,所得土壤pH(土水质量体积比1:2.5)分别为5.5、6.0、6.8、7.0和7.1(Valentinuzzi et al., 2015)。
Physical and chemical properties of Pukekohe soil, from aLandcare Research (2018) and Valentinuzzi et al. (2015). Values in brackets represent the standard error of the mean (n ¼ 3).
Pukekohe土壤的理化性质,数据来自aLandcare Research(2018)和Valentinuzzi et al.(2015)。括号内数值为平均值的标准误(n = 3)。
| aTexture profilea质地剖面 | Loam/silty loam over clay壤土/粉砂壤土覆于黏土之上 |
|---|---|
| aTopsoil clay | 22e34% |
| aDrainage class | Imperfectly/moderately well drained |
| aProfile available water (0e30 cm) | High (51e66 mm) |
| pH (H2O) | 5.95 (0.04) |
| CEC (me 100g�1) | 22 |
| Base saturation (%) | 70 |
| C (%) | 2.1 |
| N (%) | 0.23 |
| Olsen P (me 100 g�1) | 290 |
| N available (kg ha�1) | 50 |
| Total P (mg kg�1) | 3414 (26) |
| Total S (mg kg�1) | 491 (6) |
| Total Ca (mg kg�1) | 4147 (117) |
| Total Mg (mg kg�1) | 2400 (95) |
| Total K (mg kg�1) | 1951 (59) |
| Total Cd (mg kg�1) | 1.5 (0.0) |
| Total Cu (mg kg�1) | 65 (0) |
| Total Mn (mg kg�1) | 1266 (12) |
| Total Zn (mg kg�1) | 173 (1) |
| Total Fe (mg kg�1) | 44606 (96) |
| Total Pb (mg kg�1) | 61 (1) |
| Ga Ca(NO3)2-extractable (mg kg�1) | <0.005 |
| In Ca(NO3)2-extractable (mg kg�1) | <0.003 |
| Cd Ca(NO3)2-extractable (mg kg�1) | 0.015 (0.002) |
| Cu Ca(NO3)2-extractable (mg kg�1) | 0.13 (0.02) |
| Mn Ca(NO3)2-extractable (mg kg�1) | 40 (4) |
| Zn Ca(NO3)2-extractable (mg kg�1) | 0.37 (0.06) |
| Fe Ca(NO3)2-extractable (mg kg�1) | 1.65 (0.20) |
2.2. Batch sorption experiments2.2. 批量吸附试验
The partitioning of Ga and In between the soil solid and solution phases was determined using the approach described by Al Mamun et al. (2016). Briefly, 5 g (±0.1) of soil was equilibrated with a.
采用Al Mamun et al.(2016)所述方法测定Ga和In在土壤固相与溶液相之间的分配。简言之,将5 g(±0.1)土壤与
0.05 M Ca(NO3)2 solution that had been spiked with a known amount of Ga or In by mixing in an end-over-end shaker. Agitation times of 30e480 min revealed that retention was relatively stable after 120 min (Fig. S1); subsequent experiments used this equilibration time. The extraction mixture was centrifuged at 1880 g for 10 min, after which the extractant was filtered through a Whatman 51 filter. The filtrate was stored at 4 �C prior to analysis. All extractions were carried out in triplicate.
加入已知量Ga或In的0.05 M Ca(NO3)2溶液在翻转振荡器中混合平衡。振荡30–480 min的结果表明,120 min后吸持相对稳定(图S1);后续试验均采用该平衡时间。提取混合物以1880 g离心10 min,然后用Whatman 51滤纸过滤提取液。滤液于4 °C保存待测。所有提取均重复3次。
The effect of concentration on the amount removed from the solution phase was measured using soil-affected change in solubility from 0.05 M Ca(NO3)2 solutions spiked with 1, 3,10, 30,100 or 1000 mg L�1 Ga or In. The effect of pH was determined by equilibrating with the series of limed soils, using 10 mg L�1 Ga/In spiked 0.05 M Ca(NO3)2. The extractant pH in un-spiked extracts of the entire lime series was measured after 120 min agitation, using a Mettler Toledo pH meter.
以加入1、3、10、30、100或1000 mg L−1 Ga或In的0.05 M Ca(NO3)2溶液经土壤作用后溶解度的变化,测定浓度对溶液相去除量的影响。以加入10 mg L−1 Ga/In的0.05 M Ca(NO3)2与一系列加石灰土壤平衡,测定pH的影响。振荡120 min后,使用Mettler Toledo pH计测定整个石灰系列未加标提取液的pH。
2.3. Plant uptake trial2.3. 植物吸收试验
Perennial ryegrass (Lolium perenne L.) was grown in pots (diameter ca. 6.5 cm, height ca. 8 cm) containing 250 g of the Pukekohe granular soil spiked with 0, 15, 31, 63,125, 250, 500, 1000 or 2000 mg kg�1 Ga, or 0, 1.5, 3, 6, 13, 25, 50, 100 or 200 mg kg�1 In. The concentrations were based on literature contamination reports (Boughriet et al., 2007; Ha et al., 2011; Połedniok et al., 2012). Both elements were added as nitrate salts dissolved in deionized water.
将多年生黑麦草(Lolium perenne L.)种植于盆钵(直径约6.5 cm,高约8 cm)中,每盆装250 g Pukekohe粒状土壤,土壤中分别加入0、15、31、63、125、250、500、1000或2000 mg kg−1 Ga,或0、1.5、3、6、13、25、50、100或200 mg kg−1 In。上述浓度依据文献中的污染报道设定(Boughriet et al., 2007; Ha et al., 2011; Połedniok et al., 2012)。两种元素均以溶于去离子水的硝酸盐形式加入。
There were four replicates of each treatment. Pots were placed in a growth chamber (settings on Table S1) on the 31st of July 2017, in a randomised-block design. There were a total of 68 pots. Before planting (50 seeds per pot), the spiked soils were put through a wet-dry cycle and placed in a growth chamber. Planting occurred on the 7th of August 2017. Saucers were filled with water daily. Four weeks after germination, 40 mL of 10,000 mg L�1 urea (CO(NH2)2) was applied to each pot. After six weeks of growth (on the 18th of September 2017), ryegrass was harvested 1.5 cm above the soil surface, rinsed with deionized water, placed in a drying oven at 60 �C until a constant weight was obtained, and ground using a Cyclotec 1093 sample mill (FOSS Analytical A/S, Hillerød, Denmark). The dry biomass was recorded.
每个处理设4个重复。2017年7月31日按随机区组设计将盆钵置于生长室中(设置见表S1),共68盆。播种(每盆50粒种子)前,加标土壤经历一次干湿循环后置于生长室中。于2017年8月7日播种。每日向托盘加水。萌发4周后,向每盆施加40 mL 10,000 mg L−1尿素(CO(NH2)2)。生长6周后(2017年9月18日),在距土表1.5 cm处收获黑麦草,用去离子水冲洗,于60 °C烘箱中烘至恒重,并用Cyclotec 1093样品磨(FOSS Analytical A/S, Hillerød, Denmark)粉碎。记录干生物量。
2.4. Sample preparation and analysis2.4. 样品制备与分析
Plant samples underwent microwave digestion (CEM MARS Xpress, CEM Corporation, Matthews, NC, USA), where ca. 0.2 g of plant material was accurately weighed into a 50 mL Teflon reaction vessel with 2 mL 69% HNO3, 2 mL 30% H2O2. Following digestion, samples were diluted to 10 mL using distilled water. Batch sorption extracts were diluted fivefold. Gallium and In concentrations were measured in the extracts and digests using inductively-coupled plasma mass spectrometry (ICP-MS, Agilent 7500). None of the Certified Reference Materials tested (Wageningen ISE 921 & IPE 100 and NIST 1573a) contained values for Ga or In. Therefore, standard additions of 0.002 and 0.02 mg L�1 were used for quality assurance, giving recoveries of 90e95%.
植物样品采用微波消解(CEM MARS Xpress, CEM Corporation, Matthews, NC, USA),准确称取约0.2 g植物材料于50 mL聚四氟乙烯反应罐中,加入2 mL 69% HNO3和2 mL 30% H2O2。消解后用蒸馏水定容至10 mL。批量吸附提取液稀释5倍。采用电感耦合等离子体质谱(ICP-MS, Agilent 7500)测定提取液和消解液中的Ga和In含量。所测试的有证标准物质(Wageningen ISE 921 & IPE 100和NIST 1573a)均无Ga或In的定值。因此,采用0.002和0.02 mg L−1的标准加入进行质量控制,回收率为90%–95%。
The distribution coefficients (KD) (indicative of the degree of partitioning of an element between solid and solution phases) were calculated in L kg�1 (Sheppard et al., 2009) using Equation (1) and Equation (2).
利用式1和式2计算分配系数(KD)(表征元素在固相与溶液相之间的分配程度),单位为L kg−1(Sheppard et al., 2009)。


where, Cs is the concentration of Ga/In retained by the soil matrix (mg kg�1), Ci is the initial concentration in the extractant solution (mg L�1), Cf is the concentration in the filtered solution (mg L�1), V is the volume of the filtered solution (L), and m is the mass of soil used (kg). Correction factors were applied to Cf (Fig. S2).
式中,Cs为土壤基质吸持的Ga/In含量(mg kg−1),Ci为提取液的初始浓度(mg L−1),Cf为过滤后溶液的浓度(mg L−1),V为过滤后溶液的体积(L),m为所用土壤质量(kg)。对Cf进行了校正(图S2)。
Summary statistics were calculated in MS Excel; post hoc oneway ANOVA (analysis of variance) LSD (least significance differences) tests were calculated in RStudio (https://www.rstudio.com), significance at p � 0.05.
描述性统计采用MS Excel计算;单因素ANOVA(方差分析)事后LSD(最小显著差数)检验在RStudio(https://www.rstudio.com)中完成,显著性水平为p ≤ 0.05。
2.5. Speciation modelling2.5. 形态模拟
The distribution between the different species of Ga and In in the extractant solutions were modelled using Visual MINTEQ 3.1 (Gustafsson, 2013) to estimate the effect that the changes in solution pH following equilibration alone could have on the metal species’ distribution. The extractant solutions were simulated with each of the concentrations of Ga and In to estimate possible differences in aqueous hydroxide speciation and precipitation across a range of pHs. The model input parameters are given in Table S2.
采用Visual MINTEQ 3.1(Gustafsson, 2013)模拟提取液中Ga和In不同物种间的分布,以估算仅平衡后溶液pH变化对金属物种分布可能产生的影响。分别以各Ga和In浓度模拟提取液,以估算不同pH范围内水相氢氧化物形态和沉淀可能存在的差异。模型输入参数见表S2。
3Results结果
3.1. Sorption of Ga and In by soil3.1. 土壤对Ga和In的吸附
Gallium and In were strongly retained by the soil matrix.
Ga和In被土壤基质强烈吸持。
Average KD values, produced from trend-lines of soil plotted against solution concentrations, were 408 (21) L kg�1 and 2021 (64) L kg�1 for Ga and In, respectively, (with standard errors) (Fig. S3). However, the degree of sorption (adsorption and precipitation) significantly increased (p < 0.05) when KD was plotted against the concentration added to soil (Table 2). The KD of Ga rose logarithmically from 88 to 392 L kg�1 with 1e100 mg L�1 in the extracting solution. In jumped sharply from 458 to 1812 L kg�1 between 10 and 30 mg L�1.
由土壤浓度对溶液浓度作图所得趋势线计算的Ga和In平均KD值分别为408(21)L kg−1和2021(64)L kg−1(括号内为标准误)(图S3)。然而,以KD对土壤加入浓度作图时,吸附程度(吸附和沉淀)显著增加(p < 0.05)(表2)。提取液浓度为1–100 mg L−1时,Ga的KD由88呈对数增至392 L kg−1。In的KD在10至30 mg L−1之间由458骤增至1812 L kg−1。
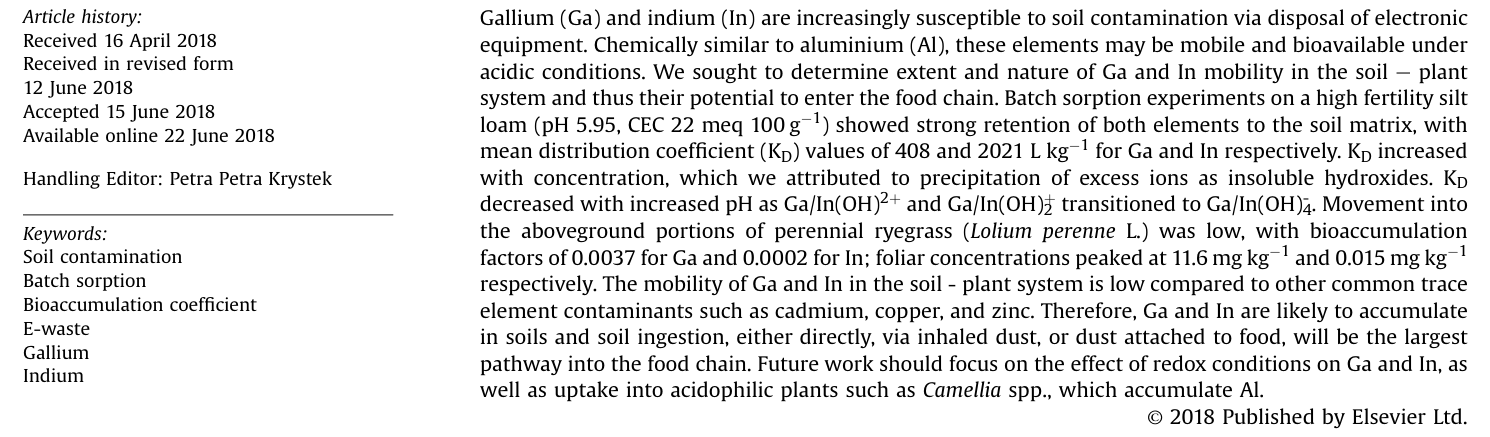
Retention of Ga and In by the soil matrix decreased as the pH of the soil solution increased, across the range tested (Fig.1). The KD of Ga significantly decreased from 689 L kg�1 at pH 5.5, to 265 L kg�1 at 7.1. Indium decreased from 1266 to 458 L kg�1 respectively, with particularly significant drops in the lowest 0.5 and highest 0.3 in the range tested. Although both trend-lines were similar in shape, the KD of In was consistently 73e153% higher than Ga.
在所测试范围内,土壤基质对Ga和In的吸持随土壤溶液pH升高而降低(图1)。Ga的KD由pH 5.5时的689 L kg−1显著降至pH 7.1时的265 L kg−1。In相应由1266降至458 L kg−1,在所测范围最低0.5和最高0.3个pH单位内下降尤为显著。尽管两条趋势线形状相似,但In的KD始终比Ga高73%–153%。
3.2. Species present in the system3.2. 体系中存在的物种
The equilibrium modelling predicted that Ga(OH)4- and In(OH)3 were the dominant species at pHs measured in the extraction solutions, accounting for >89.9% of all aqueous Ga and In (Table 3). As the pH rose from 5.5 to 7.1, anionic forms of both elements were expected to increase in dominance e Ga(OH)4- 92.4e99.9%, and In(OH)4e0.008e0.338%. Indium was predicted to slightly complex with nitrate in acidic solutions (>1% at < pH 4.8). Sufficient precipitation data proportional to aqueous species was unable to be extracted; however, the saturation index of Ga peaked at pH 5, thus decreased in the range tested (Fig. S6), and In increased to peak at 6.8e7.3 (Fig. S7). Saturation indexes increased with concentration. Partitioning of the metals between the different species across the pH range 1e14 is shown in the Supporting Information (Figs. S4 and
平衡模拟预测,在提取液所测pH条件下,Ga(OH)4-和In(OH)3为优势物种,占水相Ga和In总量的>89.9%(表3)。随pH由5.5升至7.1,预计两种元素阴离子形态的优势均增强:Ga(OH)4-由92.4%增至99.9%,In(OH)4−由0.008%增至0.338%。预测In在酸性溶液中与硝酸根有少量络合(pH < 4.8时>1%)。未能提取到与水相物种成比例的足够沉淀数据;但Ga的饱和指数在pH 5时达到峰值,因而在所测范围内降低(图S6),In的饱和指数则升高并在pH 6.8–7.3达到峰值(图S7)。饱和指数随浓度增加而升高。pH 1–14范围内金属在不同物种间的分配见补充材料(图S4和
S5).
Modelling of the spiked extraction solutions showed differences in the species distribution, depending on the spiked concentration. Cation dominance increased with concentration, with 60.4% Ga3þ and 71.9% In3þ in the 100 mg L�1 spike solutions, versus <0.1% in the 1 mg L�1 spike. Above 3 mg L�1 Ga and 30 mg L�1 In saturation indexes decreased due to pH having a larger effect than concentration on the net values; the Ga(OH)3 (am) saturation index decreased from 1.27 to 0.78, despite a rise of 1.58e3.11 from 3 to 100 mg L�1.
对加标提取液的模拟表明,物种分布因加标浓度不同而存在差异。阳离子优势随浓度增加而增强,100 mg L−1加标溶液中Ga3+和In3+分别占60.4%和71.9%,而1 mg L−1加标溶液中<0.1%。Ga浓度高于3 mg L−1、In浓度高于30 mg L−1时,由于pH对净值的影响大于浓度,饱和指数下降;尽管浓度从3增至100 mg L−1时饱和指数本应上升1.58–3.11,Ga(OH)3(am)的饱和指数仍由1.27降至0.78。
3.3. Uptake of Ga and In by ryegrass3.3. 黑麦草对Ga和In的吸收
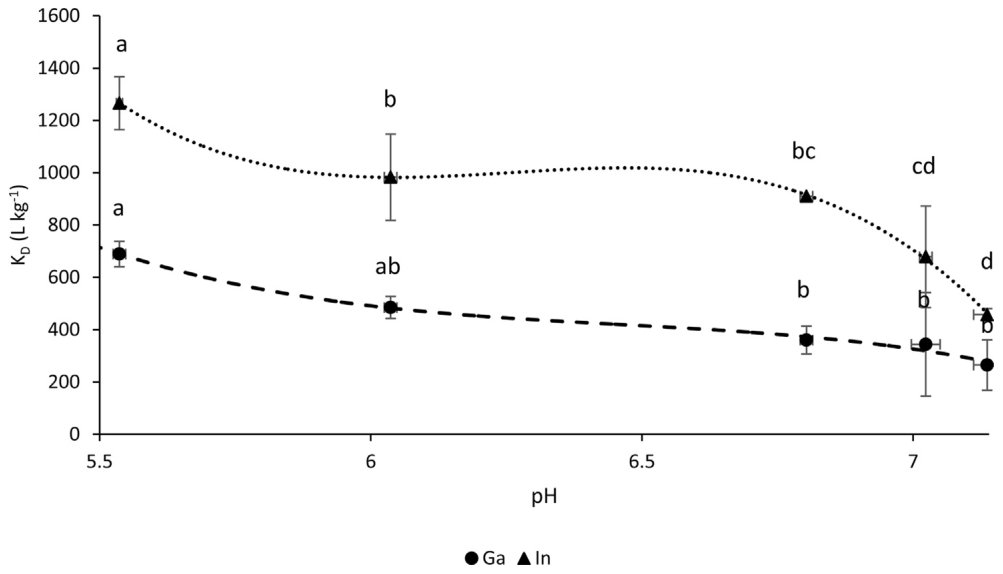
There was limited but significant transfer of both elements from soil to the leaves of perennial ryegrass (Fig. 2). Uptake of Ga peaked at 11.6 mg kg�1 with 2000 mg kg�1 added to soil, with the trend indicating further uptake is possible, while In plateaued at 0.02 with 100 mg kg�1 in soil, significantly higher than at 25 and 50 mg�1. Bioaccumulation factors (shoot concentration/soil concentration) were low, at 0.0037 Ga and 0.0002 In, and were essentially linear for all but the highest soil concentrations (R2 = 0.99). There was no significant effects of either Ga or In on the biomass of the L. perenne (data not shown). The average dry biomass per pot was 2.27 g.
两种元素由土壤向多年生黑麦草叶片的转移有限但显著(图2)。土壤加入2000 mg kg−1时Ga吸收量达到峰值11.6 mg kg−1,趋势表明仍有进一步吸收的可能;而In在土壤含量为100 mg kg−1时趋于平台,为0.02,显著高于25和50 mg−1时。生物富集系数(地上部含量/土壤含量)较低,Ga为0.0037,In为0.0002,除最高土壤浓度外基本呈线性(R2 = 0.99)。Ga和In对L. perenne生物量均无显著影响(数据未列出)。每盆平均干生物量为2.27 g。
Effect of the concentration of Ga and In added to soil on KD.
土壤中Ga和In加入浓度对KD的影响。
| Solution concentration (mg L�1)溶液浓度 (mg L−1) | Soil concentration (mg kg�1)土壤浓度 (mg kg−1) | KD Ga (L kg�1) | KD In (L kg�1) |
|---|---|---|---|
| 1 | 6 | 88 (36) a | 163 (102) a |
| 3 | 18 | 120 (73) a | 339 (147) a |
| 10 | 60 | 265 (97) b | 458 (23) a |
| 30 | 180 | 280 (33) bc | 1812 (149) ab |
| 100 | 600 | 392 (42) c | 1803 (2408) b |
Brackets denote the standard deviation of the mean; different letters denote significance; n ¼ 3. Soil concentration calculated from mass added to sample.
括号内为平均值的标准差;不同字母表示差异显著;n = 3。土壤浓度根据加入样品的质量计算。
4Discussion讨论
4.1. Mobility of Ga and In in the soil system4.1. Ga和In在土壤系统中的迁移性
Both Ga and In were bound strongly by the Pukekohe granular soil. Minimum KD values across all independent variables (pH, concentration, time) were 82 (Ga) and 163 (In). Solubility is prerequisite for mobility, and the capacity to move through the soil e plant system. Hence, as KD measures the fraction left in solution, it is sufficient for evaluation of potential mobility; however, it is useful to acknowledge its limitations as a static measure. Other factors, such as colloidal transport, could also affect movement of the metals in soils (McLaren and Cameron, 1996), however measuring these was outside the scope of this work.
Ga和In均被Pukekohe粒状土壤强烈结合。在所有自变量(pH、浓度、时间)下,KD最小值分别为82(Ga)和163(In)。溶解是迁移的前提,也是在土壤–植物系统中移动能力的前提。因此,由于KD衡量的是留在溶液中的比例,足以用于评估潜在迁移性;但也应认识到其作为静态指标的局限性。胶体迁移等其他因素也可能影响金属在土壤中的移动(McLaren and Cameron, 1996),但对其测定超出了本研究范围。
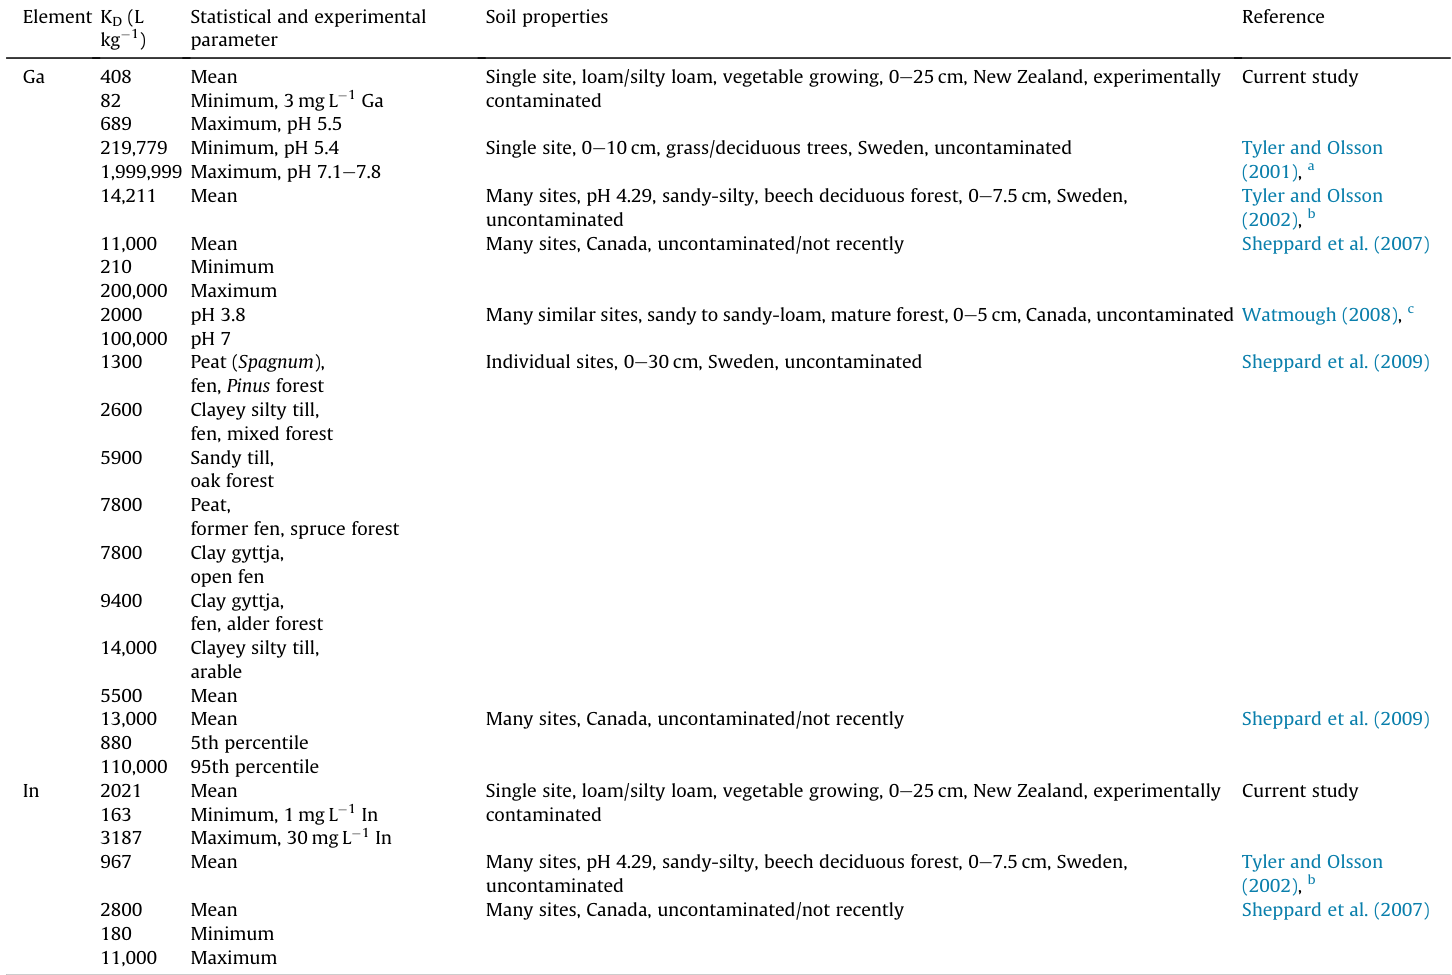
The KD values in this study for Ga, with a mean KD of 408 L kg�1, were significantly lower than the values of 11,000 and 13,000 L kg�1 reported for Canadian soils (Sheppard et al., 2007, 2009). These differences are likely due to analytical methods since there was no aging of the Ga and In in our batch experiments, thus it is likely that a greater proportion of the total Ga and In here was still in the labile pool. Precipitated Ga(OH)3 ages to less soluble a- GaOOH, with geomorphological transformation to b-Ga2O3 and other minerals possible (Pokrovski et al., 1997; Bernstein, 1998). Adsorbed Ga and In are assumed susceptible to occlusion by Mn and Fe (hydr)oxides and diffusion into mineral structures. Aqueous forms are lost through soil profile leaching or plant uptake (Alloway, 2013).
本研究中Ga的KD值(平均KD为408 L kg−1)显著低于加拿大土壤报道的11,000和13,000 L kg−1(Sheppard et al., 2007, 2009)。这些差异很可能源于分析方法,因为本批量试验中Ga和In未经老化,因此此处总Ga和In中可能有更大比例仍处于活性库中。沉淀的Ga(OH)3老化为溶解度更低的α-GaOOH,并可能经地貌转化形成β-Ga2O3及其他矿物(Pokrovski et al., 1997; Bernstein, 1998)。吸附态Ga和In被认为易被Mn和Fe(氢)氧化物包蔽并扩散进入矿物结构。水相形态则通过土壤剖面淋溶或植物吸收而损失(Alloway, 2013)。
Gallium and In are relatively immobile compared to other common trace element contaminants in soil. Sheppard et al. (2007) ranked Ga and In as the 3rd and 7th least mobile when compared with 14 common trace element contaminants, across a range of Canadian soil types without recent contamination. Gallium was shown to be comparatively immobile across several Swedish soils (Sheppard et al., 2009), and the most immobile of the examined contaminants averaged across 30 deciduous topsoils, with In placing 9/15 (Tyler and Olsson, 2002).
与土壤中其他常见微量元素污染物相比,Ga和In相对不易迁移。Sheppard et al.(2007)在多种近期未受污染的加拿大土壤类型中,将Ga和In与14种常见微量元素污染物相比,分别列为迁移性第3和第7低。在多种瑞典土壤中,Ga的迁移性相对较低(Sheppard et al., 2009);在30种落叶林表土的平均结果中,Ga是所考察污染物中迁移性最低的,In排第9/15位(Tyler and Olsson, 2002)。
4.1.1. Effect of speciation on soil mobility4.1.1. 形态对土壤迁移性的影响
Adsorption and precipitation could not be separated, limiting our understanding of the behaviour of Ga and In in the system. The solubility of Ga(OH)3(aq) and In(OH)3(aq) are low (<10�7 M pH 5e7 (Wood and Samson, 2006);) and thus readily precipitate at most commonly found soil pHs. The ionic forms are capable of labile and non-labile sorption to the soil matrix, analogous to other trace elements. As both processes can be expected to reduce the dissolved concentrations of Ga and In in the soil system, extractions do not clarify which has occurred. Minteq-predicted precipitation trends suggested that Ga and In precipitation as hydroxide species was most likely at around pH 5(Figs. S6 and S7). Gallium precipitation becomes less likely at > pH 5, due to the formation of Ga(OH)4- , while the corresponding In species only forms at above pH 8. Kopittke et al. (2009) recorded immediate 87 and 27% decreases in aqueous Ga and In, attributed solely to precipitation (no soil or plant material)-the pH range of 3.7e5.3 was closer to Ga's peak. Sequential extraction procedures (originating from the methodology of Tessier et al. (1979), such as Połedniok (2008) Ga, and Waterlot et al. (2013), Boughriet et al. (2007) and Hou et al. (2005) In) have the capacity to quantify the fraction sorbed to/in organic material, sulphides and residual minerals, but are unable to separate precipitated Ga and In from Mn and Fe (hydr)oxide adsorbed, in the oxide/reducible fraction.
由于无法区分吸附与沉淀,限制了我们对Ga和In在该体系中行为的认识。Ga(OH)3(aq)和In(OH)3(aq)的溶解度较低(pH 5–7时<10−7 M(Wood and Samson, 2006)),因此在大多数常见土壤pH下易于沉淀。其离子形态能够在土壤基质上发生活性和非活性吸附,与其他微量元素类似。由于两种过程均可降低土壤体系中Ga和In的溶解浓度,提取结果无法阐明发生的是哪一过程。Minteq预测的沉淀趋势表明,Ga和In以氢氧化物形态沉淀最可能发生在pH 5左右(图S6和S7)。pH > 5时,由于Ga(OH)4-的形成,Ga沉淀的可能性降低,而相应的In物种仅在pH 8以上才形成。Kopittke et al.(2009)记录到水相Ga和In分别立即下降87%和27%,完全归因于沉淀(无土壤或植物材料),其pH范围3.7–5.3更接近Ga的峰值。连续提取法(源自Tessier et al.(1979)的方法,如Połedniok(2008)对Ga的研究,以及Waterlot et al.(2013)、Boughriet et al.(2007)和Hou et al.(2005)对In的研究)能够量化吸附于/存在于有机质、硫化物和残渣矿物中的组分,但无法将氧化物/可还原态中沉淀的Ga和In与Mn和Fe(氢)氧化物吸附态区分开来。
Minteq predictions of relative concentrations of aqueous mononuclear Ga and In hydroxyl species, and saturation indexes of Ga and In precipitates, in extractant solutions across the pH range tested.
Minteq预测的所测pH范围内提取液中水相单核Ga和In羟基物种的相对浓度,以及Ga和In沉淀物的饱和指数。
| Lime applied (wt%)石灰施用量(wt%) | pH | Aqueous s水相物 | pecies (%)a种(%)a | Saturation indexb饱和指数b | |||||
|---|---|---|---|---|---|---|---|---|---|
| Ga/In3þ | Ga/In(OH)2þ | Ga/In(OH)2 þ | In(OH)3 (aq) | Ga/In(OH)4 - | In(NO3)2þ | Ga/In(OH)3 (am/s) | GaOOH(s) | ||
| Ga | |||||||||
| 0 | 5.5 | 0.003 | 0.279 | 7.31 | e | 92.4 | e | 2.11 | 4.21 |
| 0.31 | 6.0 | <0.001 | 0.009 | 0.785 | e | 99.2 | e | 1.64 | 3.74 |
| 0.61 | 6.8 | <0.001 | <0.001 | 0.020 | e | 99.9 | e | 0.84 | 2.94 |
| 1.25 | 7.0 | <0.001 | <0.001 | 0.008 | e | 99.9 | e | 0.64 | 2.74 |
| 10.00 | 7.1 | <0.001 | <0.001 | 0.005 | e | 99.9 | e | 0.54 | 2.64 |
| In | |||||||||
| 0 | 5.5 | 0.082 | 0.682 | 10.2 | 89.0 | 0.008 | 0.012 | 3.09 | e |
| 0.31 | 6.0 | 0.003 | 0.074 | 3.48 | 96.4 | 0.026 | <0.001 | 3.24 | e |
| 0.61 | 6.8 | <0.001 | 0.002 | 0.568 | 99.3 | 0.169 | <0.001 | 3.25 | e |
| 1.25 | 7.0 | <0.001 | 0.001 | 0.359 | 99.4 | 0.269 | <0.001 | 3.25 | e |
| 10.00 | 7.1 | <0.001 | <0.001 | 0.285 | 99.4 | 0.338 | <0.001 | 3.25 | e |
a Percentage of the total concentration of aqueous Ga/In. b Saturation index (SI) > 0 denotes oversaturation and further precipitation; SI < 0 dissolution.
a 占水相Ga/In总浓度的百分比。b 饱和指数(SI)> 0表示过饱和并进一步沉淀;SI < 0表示溶解。
The decrease in KD with pH may be attributed to the formation of poorly-adsorbing dissolved anionic metal (oxyhydr)oxide species, as suggested by modelling. Most soils have a net negative charge, with higher cation than anion adsorption capacity that increases as pH increases. Pukekohe soil had a CEC of 22 me 100 g�1, considered medium within New Zealand (Blakemore et al., 1981). When the KD of In dropped from 910 to 458 L kg�1 at pH 6.80 to 7.1, the proportion of In(OH)2+ was predicted to decrease from 0.568 to 0.285%, and In(OH)4- increased from 0.169 to 0.338% (Table 3). In the first significant drop (1266e983 L kg�1, at pH 5.5e6.0), total cationic In was predicted to have decreased from 11% to 4%. Lower precipitation cannot be attributed to either scenario; the relative saturation index is likely to have remained constantly high across this pH range. In the significant decrease in Ga KD of 689e360 L kg�1 at pH 5.5e6.8, cationic Ga decreased from 7.6% to 0.02%; however, precipitation also decreased (14%) thus both processes are likely to contribute. Due to the acidifying hydrolysis demonstrated in Table 4, cationic dominance was greater than predicted, but the degree is consistent across the range and the examples are still valid. As hydroxide partitioning is not linear (Figs. S4 and S5, Wood and Samson (2006)) and believed to be a determinant factor, a linear trendline was not forced through the data (Fig. 1). Data from Bi and Westerhoff (2016) supports this theory. Sorption of Ga to SiO2 and Al2O3 was much lower at pH 9.5 than 4.5 and 7; Al2O3 had a greater affinity for the cations, and the strongly negative SiO2 (point of zero charge ~2) repelled Ga(OH)4- . Precipitation of In meant the methodology was not feasible at the higher two pH parameters; thus, unable to be determined if trends were similar.
如模拟所示,KD随pH降低可能归因于形成了吸附能力弱的溶解态阴离子金属(羟基)氧化物物种。大多数土壤带净负电荷,阳离子吸附容量高于阴离子,且随pH升高而增大。Pukekohe土壤的CEC为22 me 100 g−1,在新西兰属中等水平(Blakemore et al., 1981)。当pH由6.80升至7.1、In的KD由910降至458 L kg−1时,预测In(OH)2+比例由0.568%降至0.285%,In(OH)4-由0.169%增至0.338%(表3)。在第一次显著下降中(pH 5.5–6.0,1266–983 L kg−1),预测阳离子In总量由11%降至4%。沉淀减少不能解释上述任一情形;在该pH范围内相对饱和指数很可能始终保持较高水平。在pH 5.5–6.8范围内Ga的KD由689显著降至360 L kg−1,阳离子Ga由7.6%降至0.02%;但沉淀也减少了(14%),因此两种过程可能共同起作用。由于表4所示的致酸水解作用,阳离子优势高于预测值,但其程度在整个范围内一致,上述例子依然成立。由于氢氧化物分配并非线性(图S4和S5,Wood and Samson(2006)),且被认为是决定性因素,故未对数据强制拟合线性趋势线(图1)。Bi and Westerhoff(2016)的数据支持这一理论。pH 9.5时Ga在SiO2和Al2O3上的吸附远低于pH 4.5和7时;Al2O3对阳离子具有更高亲和力,而强负电性的SiO2(零电荷点~2)排斥Ga(OH)4-。由于In发生沉淀,该方法在较高的两个pH条件下不可行,因此无法确定其趋势是否相似。
Prior studies are not in agreement with the trends observed, with further work required to reach a consensus. Aqueous Ga decreased from 0.06 mg L�1 to 0.015 mg L�1 as the pH rose from 5.37 to 7.25 in work by Tyler and Olsson (2001). Similarly, in Su et al. (2018) pore water concentrations were approximately 514 mg L�1 Ga and 474 mg L�1 In in the pH 4.1 soil, versus 230 mg L�1 Ga and 0.38 mg L�1 In at pH 7.4, in 400 mg kg�1 spiked soil zero days after planting. The lower solubility of Al in the neutral soil was shown to be partially responsible, though differences in properties (CEC, organic matter, oxalate and dithionate extractable Fe and Al) likely also contributed. Cation exchange capacities of both their soils were lower than Pukekohe, at 7.8 and 9.3 versus 22 me 100 g�1, respectively, and pH values were beyond the range tested (the polynomial trend-line in Fig. 1 cannot be accurately extrapolated). Logarithmic increases in KD by Watmough (2008), from 10,000 L kg�1 at pH 4 to almost 100,000 L kg�1 at pH 7 in similar forested soils, may be attributed to acidifying weathering also increasing the rate at that Ga is released from the mineral matrix and into the exchangeable fraction (Sohlenius et al., 2013).
既往研究与本研究观察到的趋势并不一致,需要进一步研究以达成共识。Tyler and Olsson(2001)的研究中,随pH由5.37升至7.25,水相Ga由0.06 mg L−1降至0.015 mg L−1。同样,Su et al.(2018)在加标400 mg kg−1的土壤中,种植后第0天,pH 4.1土壤孔隙水中Ga和In浓度约为514 mg L−1和474 mg L−1,而pH 7.4时为230 mg L−1 Ga和0.38 mg L−1 In。研究表明,中性土壤中Al溶解度较低是部分原因,但性质差异(CEC、有机质、草酸盐和连二亚硫酸盐可提取Fe和Al)可能也有贡献。其两种土壤的阳离子交换量均低于Pukekohe土壤,分别为7.8和9.3,而后者为22 me 100 g−1,且其pH值超出了本研究测试范围(图1中的多项式趋势线不能准确外推)。Watmough(2008)在类似森林土壤中观察到KD由pH 4时的10,000 L kg−1呈对数增至pH 7时的近100,000 L kg−1,这可能归因于致酸风化同时提高了Ga从矿物基质释放进入可交换态的速率(Sohlenius et al., 2013)。
Hydroxide precipitation was hypothesised responsible for the increase in KD with addition to the system. This trend observed in Table 2 was unexpected, as the distribution coefficient of many trace elements, such as Cd, Cu, and Pb, decreases with concentration; adsorption sites become saturated, thus a larger mass must remain in solution (Shaheen et al., 2013). Aqueous Ga and In increased 2068% and 666% respectively as spiking increased from 1 to 100 mg L�1; however, the larger increase in the solid fraction (11% and 102%) caused KD to rise. Modelling by Minteq and Staff et al. (2010) predicted that hydroxide partitioning was not affected by concentration within the same pH range. Thus, production of Ga/In(OH)3 increased, rising further above the low solubility threshold. Saturation indexes greater than zero (Figs. S6 and S7) indicated oversaturation thus precipitation proportional to the mass entering the system. Two previous studies observed similar patterns; aqueous In was 0.02e0.04 mg L�1 in contaminated Vietnamese soils, with total soil In concentration around 100 mg kg�1 (Ha et al., 2011). Połedniok (2008) measured a 0.5 mg kg�1 difference in extractable Ga despite the industrial soil containing 93 mg kg�1 versus 38 mg kg�1 total, likely attributed to precipitation in the 175% larger oxide fraction.
推测氢氧化物沉淀是KD随体系加入量增加而升高的原因。表2中观察到的这一趋势出乎意料,因为许多微量元素(如Cd、Cu和Pb)的分配系数随浓度增加而降低;吸附位点趋于饱和,因而必有更多质量留在溶液中(Shaheen et al., 2013)。随加标浓度由1增至100 mg L−1,水相Ga和In分别增加2068%和666%;但固相组分增幅更大(11%和102%),导致KD升高。Minteq模拟及Staff et al.(2010)预测,在相同pH范围内氢氧化物分配不受浓度影响。因此,Ga/In(OH)3的生成量增加,进一步超出其低溶解度阈值。饱和指数大于零(图S6和S7)表明过饱和,因而沉淀量与进入体系的质量成正比。已有两项研究观察到类似规律:在受污染的越南土壤中,土壤总In含量约为100 mg kg−1时,水相In为0.02–0.04 mg L−1(Ha et al., 2011)。Połedniok(2008)测得,尽管工业土壤总Ga含量为93 mg kg−1,而对照为38 mg kg−1,但可提取态Ga仅相差0.5 mg kg−1,这可能归因于氧化物组分(大175%)中的沉淀。
Minteq predictions of relative concentrations of aqueous mononuclear Ga and In hydroxyl species, and saturation indexes of Ga and In precipitates, in extractant solution across the concentration gradient tested.
Minteq预测的所测浓度梯度下提取液中水相单核Ga和In羟基物种的相对浓度,以及Ga和In沉淀物的饱和指数。
| Concentration in solution (mg L�1)溶液浓度(mg L−1) | pH | Aqueous水相 | species (%)物种(%) | Saturation index (at pH 5.5)饱和指数 (pH 5.5时) | |||||
|---|---|---|---|---|---|---|---|---|---|
| Ga/In3þ | Ga/In(OH)2þ | Ga/In(OH)2 þ | In(OH)3 (aq) | Ga/In(OH)4 - | In(NO3)2þ | Ga/In(OH)3 (am) | GaOOH(s) | ||
| Ga | |||||||||
| No soil pH change | 5.5 | 0.003 | 0.279 | 7.31 | e | 92.4 | e | e | e |
| 1 | 4.6 | 1.50 | 18.2 | 65.0 | e | 15.3 | e | 1.16 | 3.26 |
| (1.11) | (3.21) | ||||||||
| 3 | 4.3 | 6.44 | 35.0 | 56.0 | e | 2.64 | e | 1.27 (1.58) | 3.38 (3.69) |
| 10 | 3.9 | 20.6 | 47.2 | 31.9 | e | 0.268 | e | 1.14 (2.11) | 3.24 (4.21) |
| 30 | 3.6 | 39.8 | 45.1 | 15.1 | e | 0.031 | e | 0.99 (2.58) | 3.09 (4.69) |
| 100 | 3.3 | 60.4 | 33.9 | 5.66 | e | 0.003 | e | 0.78 (3.11) | 2.89 (5.21) |
| In | |||||||||
| No soil pH change | 5.5 | 0.082 | 0.012 | 10.170 | 89.046 | 0.008 | 0.012 | e | e |
| 1 | 4.8 | 5.95 | 10.0 | 30.1 | 53.1 | 0.001 | 0.896 | 1.98 (2.21) | e |
| 3 | 4.5 | 22.5 | 19.1 | 29.1 | 25.9 | <0.001 | 3.40 | 2.13 (2.68) | e |
| 10 | 4.3 | 45.0 | 21.3 | 18.0 | 8.90 | <0.001 | 6.79 | 2.30 (3.21) | e |
| 30 | 4.1 | 60.8 | 17.8 | 9.34 | 2.87 | <0.001 | 9.18 | 2.33 (3.68) | e |
| 100 | 3.8 | 71.9 | 12.6 | 3.93 | 0.72 | <0.001 | 10.9 | 2.05 (4.21) | e |
| Unspiked 0.05 M Ca(NO3)2 solution | |||||||||
| 0 | 5.6 | e | e | e | e | e | e | e | e |
The pH was not controlled in the concentration gradient batch sorption experiments; thus, acidity-exacerbated adsorption is also likely to have contributed to the increase in matrix retention. Only soil without lime was used with pH assumed consistent at 5.5. Later modelling demonstrated that Ga(NO3)3 and In(NO3)3 undergo extensive hydrolysis that can greatly reduce the pH (Table 4). In the extractant solutions, reductions in pH of 1.8 and 2.3 were predicted with 100 mg L�1 In and Ga respectively. Because the pH of the spiked extracts after equilibration was not measured, the actual reductions are unknown, however, it is likely that the buffering capacity of the soil is likely to have resisted the pH change. This capacity is expected to be medium-high for the Pukekohe soil with a medium CEC and high base saturation (Blakemore et al., 1981).
浓度梯度批量吸附试验中未控制pH;因此,酸度加剧的吸附也可能对基质吸持的增加有所贡献。仅使用未加石灰的土壤,并假定pH恒定为5.5。后续模拟表明,Ga(NO3)3和In(NO3)3会发生强烈水解,可大幅降低pH(表4)。预测在提取液中,100 mg L−1 In和Ga分别使pH降低1.8和2.3。由于未测定加标提取液平衡后的pH,实际降幅未知;但土壤的缓冲能力很可能抵御了pH变化。对于CEC中等、盐基饱和度高的Pukekohe土壤,预计其缓冲能力为中至高(Blakemore et al., 1981)。
The increase in distribution coefficient with concentration trend may be explanatory of why In had a lower KD than Ga in literature, despite the opposite in this study. Across all treatments, In retention was consistently higher than Ga (Fig.1, Table 2, Fig. S1). In Tyler and Olsson (2002) KD values were 14,211 and 967 L kg�1 for Ga and In respectively, but concentrations in the uncontaminated soils were much higher for Ga, at 5.4 mg kg�1 Ga and 0.029 mg kg�1 In. Data assumed close to background levels (3e70 mg kg�1 Ga, 0.01e0.5 mg kg�1 In (Kabata-Pendias and Mukherjee, 2007)) were used in Sheppard et al. (2007), with distribution coefficients of 11,000 L kg�1 Ga and 2800 L kg�1 In.
KD随浓度增加的趋势或可解释为何文献中In的KD低于Ga,而本研究结果恰好相反。在所有处理中,In的吸持始终高于Ga(图1,表2,图S1)。Tyler and Olsson(2002)报道Ga和In的KD值分别为14,211和967 L kg−1,但未污染土壤中Ga的含量高得多,为5.4 mg kg−1 Ga和0.029 mg kg−1 In。Sheppard et al.(2007)采用假定接近背景水平的数据(3–70 mg kg−1 Ga,0.01–0.5 mg kg−1 In(Kabata-Pendias and Mukherjee, 2007)),所得分配系数为11,000 L kg−1 Ga和2800 L kg−1 In。
Minteq modelling was used as a guide to estimate processes and identify trends within the system; few parameters and absence of soil limited its accuracy. Discussed earlier, hydroxide partitioning was believed to deviate to an unknown degree from the unspiked soil pH values considered in the modelling. The exact composition of the extractant solutions was unknown-soil colloids contain organic material and inorganic species, that had the capacity to be released during agitation. Our soil had a CEC of 22 me 100 g�1, of which 70% was occupied by the basic cations Ca2þ, Mg2þ, K+ and Na+.
Minteq模拟仅作为估算体系内过程和识别趋势的参考;参数较少且不含土壤限制了其准确性。如前所述,氢氧化物分配被认为在未知程度上偏离了模拟中所采用的未加标土壤pH值。提取液的确切组成未知:土壤胶体含有有机质和无机物种,可能在振荡过程中释放。本研究土壤的CEC为22 me 100 g−1,其中70%由盐基阳离子Ca2+、Mg2+、K+和Na+占据。
4.2. Mobility of Ga and In in the plant system4.2. Ga和In在植物系统中的迁移性
Perennial ryegrass was capable of adsorbing and translocating significant quantities of Ga and In to shoot biomass, though concentrations were low compared to soil additions. Data showed just 0.37% and 0.02% of spiked Ga and In respectively entered leaves (Fig. 2), but the amount taken up increased with contamination (p > 0.05). Concentrations applied (15e2000 mg kg�1 Ga, 1.5e200 mg kg�1 In) were above natural soil levels (particularly In), but were within the range of many earlier contamination reports (Boughriet et al., 2007; Ha et al., 2011; Połedniok et al., 2012). Higher In uptake in perennial ryegrass was recorded by Waterlot et al. (2013), peaking at 0.0509 mg kg�1 with bioaccumulation factors of 0.04e0.22. Little physiological difference was expected as the same species were used, thus this data demonstrates the importance of soil mobility on the capacity for uptake. Although the KD was not measured in that work, the slightly lower CEC (16.2 and 18.0 versus 22 me 100 g�1) and higher pH (7.3e7.5 versus 5.5) in their contaminated soils may have contributed to lower values and, hence greater bioavailability. Extremely high concentrations in hydroponic rice, up to 74 mg kg�1 Ga and 151 mg kg�1 In may have been possible due to the absence of soil (Syu et al., 2017); soil experimentation only yielded 10 mg kg�1 Ga and 8.3 mg kg�1 In (Su et al., 2018). The plateau of 0.015 mg kg�1 In observed in this study may be due to rhizotoxicity, but could not be verified with data collected. Syu et al. (2017) found that just 0.08 mg L�1 solution In caused significant reductions in root and shoot biomass for rice seedlings, though both increased with 15 mg L�1 Ga.
多年生黑麦草能够吸收并向地上部生物量转运相当数量的Ga和In,但其含量与土壤加入量相比较低。数据显示,加标Ga和In分别仅有0.37%和0.02%进入叶片(图2),但吸收量随污染程度增加而增加(p > 0.05)。所施加浓度(15–2000 mg kg−1 Ga,1.5–200 mg kg−1 In)高于土壤自然水平(尤其是In),但处于许多早期污染报道的范围之内(Boughriet et al., 2007; Ha et al., 2011; Połedniok et al., 2012)。Waterlot et al.(2013)记录的多年生黑麦草In吸收量更高,峰值为0.0509 mg kg−1,生物富集系数为0.04–0.22。由于所用物种相同,预计生理差异不大,因此该数据表明土壤迁移性对吸收能力的重要性。尽管该研究未测定KD,但其污染土壤较低的CEC(16.2和18.0,本研究为22 me 100 g−1)和较高的pH(7.3–7.5,本研究为5.5)可能导致KD值较低,从而生物有效性更高。水培水稻中极高的含量(高达74 mg kg−1 Ga和151 mg kg−1 In)可能是由于不存在土壤(Syu et al., 2017);土培试验仅得到10 mg kg−1 Ga和8.3 mg kg−1 In(Su et al., 2018)。本研究观察到的In平台值0.015 mg kg−1可能源于根毒性,但所收集的数据无法证实。Syu et al.(2017)发现,溶液In仅0.08 mg L−1即可使水稻幼苗根和地上部生物量显著降低,而15 mg L−1 Ga则使二者均增加。
Root cell retention likely further restricted movement of these elements into ryegrass leaves. Concentrations of Ga and In below ground were not measured, but prior literature has proven this process happens in a range of species. Other members of the Poaceae family reported shoot: root ratio of <1, with 0.0279 Ga in barley/wheat stem (Omberg et al., 2011), 0.11 in wheat (Wheeler and Power, 1995), 0.082e0.223 Ga in Arabidopsis thaliana (Chang et al., 2017), and <0.01e0.47 Ga with <0.01e0.44 In in rice seedlings (Syu et al., 2017). Leaf: soil ratios were just 0.077 and 0.029 for Ga and In, compared to root: soil ratios of 0.15 and 0.11 in acidic beech forest, showing limited quantities had translocated (Tyler, 2004, 2005).
根细胞滞留很可能进一步限制了这些元素向黑麦草叶片的迁移。本研究未测定地下部Ga和In含量,但既往文献已证实该过程在多种物种中存在。禾本科其他成员的地上部:根比值<1,大麦/小麦茎中Ga为0.0279(Omberg et al., 2011),小麦中为0.11(Wheeler and Power, 1995),Arabidopsis thaliana中Ga为0.082–0.223(Chang et al., 2017),水稻幼苗中Ga为<0.01–0.47、In为<0.01–0.44(Syu et al., 2017)。在酸性山毛榉林中,Ga和In的叶片:土壤比值仅为0.077和0.029,而根:土壤比值为0.15和0.11,表明转运量有限(Tyler, 2004, 2005)。
A comparison of the bioaccumulation factors of Ga and In with other trace elements indicates that Ga and In are relatively immobile in the soil-plant system in its entirety, however data is sparse (Table S3). Gallium had the second and fourth lowest bioaccumulation factors in barley and wheat grains, from Swedish studies by Eriksson (2001) and Oguchi et al. (2011) respectively. Waterlot et al. (2013) measured that In was the second least mobile, behind Pb, in ryegrass and lettuce leaves. Indium was less mobile than 7 other contaminants in a variety of vegetables (Li et al., 2016). Indium and Ga had the third and ninth least movement to beech leaves (Tyler, 2005), with third and fourth from soil to roots (Tyler, 2004) in the acidic organic horizon in both studies. In Su et al. (2018) rice plant bioaccumulation factors averaged 0.072 Ga 0.071 In, and 0.014 Ga 0.013 In in acidic and neutral soils respectively, attributed to pH determinant bioavailability. Omberg et al. (2011) found a correlation of r ¼ �0.45 between KD and bioaccumulation factors across many elements and plant organs, and the bioaccumulation factors of grains were lower than stems and roots on the same plants, due to the requirement for physiological transport and lack of dust particles. Of the studies in which contamination occurred, severity and time varied, altering the size of the labile pool. This was demonstrated earlier to drastically affect KD, through comparison of our data and literature (Table 5). In addition, bioaccumulation factors from this study and Su et al. (2018) were calculated relative to the concentration applied shortly before experimentation, versus the total concentration in the soil. Throughout various environments and methodologies, mean shoot uptake never exceeded 7.7% applied or total Ga, and 8.1% In.
Ga和In与其他微量元素生物富集系数的比较表明,Ga和In在整个土壤–植物系统中相对不易迁移,但数据较为稀少(表S3)。在Eriksson(2001)和Oguchi et al.(2011)的瑞典研究中,Ga在大麦和小麦籽粒中的生物富集系数分别为第二低和第四低。Waterlot et al.(2013)测得,在黑麦草和生菜叶片中,In的迁移性仅高于Pb,位列倒数第二。在多种蔬菜中,In的迁移性低于其他7种污染物(Li et al., 2016)。在两项研究的酸性有机层中,In和Ga向山毛榉叶片的迁移量分别为第三低和第九低(Tyler, 2005),从土壤向根部的迁移量分别为第三低和第四低(Tyler, 2004)。Su et al.(2018)研究中,酸性和中性土壤中水稻植株的生物富集系数平均分别为0.072(Ga)、0.071(In)和0.014(Ga)、0.013(In),归因于pH决定的生物有效性。Omberg et al.(2011)发现,在多种元素和植物器官中,KD与生物富集系数之间的相关系数r = −0.45,且同一植株籽粒的生物富集系数低于茎和根,这是由于籽粒需要生理运输且无粉尘颗粒附着。在涉及污染的研究中,污染程度和时间各不相同,从而改变了活性库的大小。前文通过将本研究数据与文献比较(表5),已证明这会显著影响KD。此外,本研究和Su et al.(2018)的生物富集系数是相对于试验前不久施加的浓度计算的,而非土壤中的总浓度。在各种环境和方法下,地上部平均吸收量从未超过施加量或总量的7.7%(Ga)和8.1%(In)。
4.3. Potential for movement into the food chain4.3. 进入食物链的潜力
Although little Ga and In taken up by ryegrass, the impact on animal health cannot be currently predicted. Data and findings from Waterlot et al. (2013) showed that �0.37% of added Ga and �0.05 mg kg�1 In was likely to be taken up by ryegrass, as the soil matrix and outer root cells provide effective barriers. A 500 kg Friesian cow, fed 17.3 kg of 11.0 MJ ME kg�1 DM ryegrass and producing 1.6 kg milk solids, could ingest up to 200 mg Ga or 0.88 mg In daily (Dairy NZ; Waterlot et al., 2013); A 50 kg sheep foraging 1.4 kg ryegrass could ingest 16 mg Ga or 0.071 mg In (Freer et al., 2012). However, neither the acute nor chronic consequences to animal health are known; toxicity has not been fully investigated nor is there a concentration threshold.
尽管黑麦草吸收的Ga和In很少,但目前尚无法预测其对动物健康的影响。本研究数据及Waterlot et al.(2013)的结果表明,由于土壤基质和根外层细胞构成有效屏障,黑麦草可能吸收≤0.37%的加入Ga和≤0.05 mg kg−1的In。一头500 kg的弗里斯兰奶牛,饲喂17.3 kg代谢能为11.0 MJ ME kg−1 DM的黑麦草、产乳固体1.6 kg,每日可能摄入最多200 mg Ga或0.88 mg In(Dairy NZ; Waterlot et al., 2013);一只50 kg的绵羊采食1.4 kg黑麦草,可能摄入16 mg Ga或0.071 mg In(Freer et al., 2012)。然而,其对动物健康的急性和慢性后果均未知;毒性尚未得到充分研究,也无浓度阈值。
The risk of entry via drinking water is low, due to filtration of precipitates. The recommended pH of tap water, 7.0e8.5 (Ministry of Health, 2008), falls within the peak precipitation range of In (~4.5e9) with high precipitation of Ga (1 mM solubility) (Bernstein, 1998; Wood and Samson, 2006). Across a range of natural water bodies, just �0.03 mg L�1 Ga and 0.1 ng kg�1 In has been reported (Kabata-Pendias and Mukherjee, 2007). Soil retention is effective at restricting movement into waterbodies; �40% In leached 35 cm in 18 months, with only 5e38% moving below the top 2 cm in several soil types (Hou et al., 2005). Stream water contained 1e79 pmol L�1 Ga versus 4.6e33 mg kg�1 in associated Californian topsoil (Shiller and Frilot, 1996).
由于沉淀物被过滤,经饮用水进入的风险较低。自来水推荐pH为7.0–8.5(Ministry of Health, 2008),处于In的沉淀峰值范围(~4.5–9)内,Ga也有较高沉淀(溶解度1 mM)(Bernstein, 1998; Wood and Samson, 2006)。在多种天然水体中,报道的Ga含量仅≤0.03 mg L−1,In含量为0.1 ng kg−1(Kabata-Pendias and Mukherjee, 2007)。土壤吸持能有效限制其向水体迁移;18个月内≤40%的In淋溶至35 cm深处,在多种土壤类型中仅有5%–38%迁移至表层2 cm以下(Hou et al., 2005)。加利福尼亚溪流水中Ga为1–79 pmol L−1,而相应表土中为4.6–33 mg kg−1(Shiller and Frilot, 1996)。
Comparison of Ga and In KD values in literature.
文献中Ga和In的KD值比较。
a Calculated from graphical solution data and the total solution concentration. b calculated from table data. c collected from graph.
a 根据图示溶液数据和溶液总浓度计算。b 根据表格数据计算。c 从图中读取。
Gallium and In have a high risk of entering the food chain through direct ingestion of soil particles on contaminated soils by animals. Gallium and In are strongly retained by the soil matrix, thus most of the contaminant mass travels with dust. Soil is frequently ingested via retention to food, inhalation of airborne matter, and directly by animals and children. This quantity is dependent on several factors including the rate of soil erosion and steps involved in food processing. Ingestion of soil containing 200 mg kg�1 Ga or 20 mg kg�1 In could cause daily consumption of 0.04e0.13 mg Ga or 0.004e0.013 mg In in humans (207e625 mg soil daily (Davis and Mirick, 2006)), 29 mg Ga or 2.9 mg In sheep (9.5% of diet DM (Freer et al., 2012; Ford and Beyer, 2014)), and 340 mg Ga or 34 mg In for dairy cattle (9% of diet (Dairy NZ; Ford and Beyer, 2014)).
在受污染土壤上,动物直接摄入土壤颗粒使Ga和In进入食物链的风险较高。Ga和In被土壤基质强烈吸持,因此大部分污染物质量随粉尘迁移。土壤常通过附着于食物、吸入空气颗粒物以及动物和儿童直接摄入等途径被摄取。摄入量取决于多种因素,包括土壤侵蚀速率和食品加工步骤。摄入含200 mg kg−1 Ga或20 mg kg−1 In的土壤,可导致人类每日摄入0.04–0.13 mg Ga或0.004–0.013 mg In(每日摄入土壤207–625 mg(Davis and Mirick, 2006)),绵羊29 mg Ga或2.9 mg In(占日粮DM的9.5%(Freer et al., 2012; Ford and Beyer, 2014)),奶牛340 mg Ga或34 mg In(占日粮的9%(Dairy NZ; Ford and Beyer, 2014))。
5Conclusions结论
Gallium and In have low mobility in the soil e plant system. As hypothesised, both elements are quickly immobilised in soil; the size of the retained fraction increases with concentration and acidity, likely due to hydroxide precipitation and transition of aqueous species to cations. Perennial ryegrass is capable of uptake and translocation of small yet significant quantities of Ga and In; thus, there is a small pathway for these elements to enter the food chain. Direct ingestion of soil, particularly sorbed to food, is a much larger pathway and risk. Further work should investigate their behaviour of Ga and In under contrasting redox environments and with a range of plant species, particularly those that take up large concentrations of Al, such as Camellia spp.
Ga和In在土壤–植物系统中的迁移性较低。正如假设所述,两种元素在土壤中均被迅速固定;被截留部分的比例随浓度和酸度的升高而增大,这可能是由于氢氧化物沉淀以及水溶态物种向阳离子形态的转变所致。多年生黑麦草能够吸收并向地上部转运少量但显著的Ga和In;因此,这些元素存在一条进入食物链的次要途径。直接摄入土壤(特别是吸附于食物上的土壤)是一条大得多的暴露途径和风险来源。今后的研究应考察Ga和In在不同氧化还原环境下以及在多种植物物种中的行为,特别是那些大量吸收Al的植物,如山茶属(Camellia spp.)植物。
Acknowledgement致谢
This work was partially funded by the Centre for Integrated Biowaste Research (CIBR).
本研究部分由综合生物废弃物研究中心(Centre for Integrated Biowaste Research, CIBR)资助。
Appendix A. Supplementary data附录A. 补充数据
Supplementary data related to this article can be found at https://doi.org/10.1016/j.chemosphere.2018.06.111.
本文相关补充数据见 https://doi.org/10.1016/j.chemosphere.2018.06.111。
References参考文献
Ahlberg, G., Gustafsson, O., Wedel, P., 2006. Leaching of metals from sewage sludge during one year and their relationship to particle size. Environ. Pollut. 144, 545e553.
Aide, M., 2009. Three Missouri alfisols impacted by aeolian deposition of lead-zinccadmium-silver-indium bearing mine tailings. Soil Sediment Contam. 18, 43e54.
Al Mamun, S., Chanson, G., Muliadi, Benyas, E., Aktar, M., Lehto, N., McDowell, R., Cavanagh, J., Kellermann, L., Clucas, L., Robinson, B., 2016. Municipal composts reduce the transfer of Cd from soil to vegetables. Environ. Pollut. 213, 8e15. Alloway, B.J., 2013. Heavy Metals in Soils. Springer.
Ayadi, A., Maghraoui, S., Kammoun, S., Tekaya, L., 2014. Effects of the presence of indium on the mammary gland ultrastructure, body weight, food intake and plasmatic prolactin concentration. J. Electron. Microsc. 63, 383e389.
Bernstein, L.R., 1998. Mechanisms of therapeutic activity for gallium. Pharmacol. Rev. 50, 665e682.
Bi, X., Westerhoff, P., 2016. Adsorption of iii/v ions (In (iii), Ga (iii) and as (v)) onto SiO 2, CeO 2 and Al 2 O 3 nanoparticles used in the semiconductor industry. Environ. Sci. J. Integr. Environ. Res.: Nano 3, 1014e1026.
Blakemore, L., Searle, P., Daly, B., 1981. Methods for Chemical Analysis of Soils. New Zealand Soil Bureau Scientific Report 10 A. CSIRO (Lower Hutt, New Zealand).
Boros, E., Marquez, B.V., Ikotun, O.F., Lapi, S.E., Ferreira, C.L., 2014. Coordination chemistry and ligand design in the development of metal based radiopharmaceuticals. Ligand Design in Medicinal Inorganic Chemistry 47e79.
Boughriet, A., Proix, N., Billon, G., Recourt, P., Ouddane, B., 2007. Environmental impacts of heavy metal discharges from a smelter in Deûle-canal sediments (Northern France): concentration levels and chemical fractionation. Water Air Soil Pollut. 180, 83e95.
Butcher, T., Brown, T., 2014. Gallium. Critical Metals Handbook, pp. 150e176.
Chang, H.F., Wang, S.L., Yeh, K.C., 2017. Effect of gallium exposure in Arabidopsis thaliana is similar to aluminum stress. Environ. Sci. Technol. 51, 1241e1248. Chen, J., Luong, H., Liu, J., 2015. Fractionation and release behaviors of metals (In, Mo, Sr) from industrial sludge. Water Res. 82, 86e93. Dairy NZ, Lactating Cows.
Davis, S., Mirick, D.K., 2006. Soil ingestion in children and adults in the same family. J. Expo. Sci. Environ. Epidemiol. 16, 63.
Desutter, T.M., Godsey, C.B., 2010. Sugar-beet-processing lime as an amendment for low pH soils. Commun. Soil Sci. Plant Anal. 41, 1789e1796.
Dursun, N., Ozcan, M.M., Kasik, G., Ozturk, C., 2006. Mineral contents of 34 species of edible mushrooms growing wild in Turkey. J. Sci. Food Agric. 86, 1087e1094. Eriksson, J., 2001. Concentrations of 61 Trace Elements in Sewage Sludge, Farmyard Manure, Mineral Fertiliser, Precipitation and in Oil and Crops. Swedish Environmental Protection Agency Stockholm.
Eticha, D., Stass, A., Horst, W.J., 2005. Cell-wall pectin and its degree of methylation in the maize root-apex: significance for genotypic differences in aluminium resistance. Plant Cell Environ. 28, 1410e1420.
Fang, Z., Gesser, H., 1996. Recovery of gallium from coal fly ash. Hydrometallurgy 41, 187e200.
Font, O., Querol, X., Juan, R., Casado, R., Ruiz, C.R., Lopez-Soler,� A., Coca, P., Pe� na, F.G.,~ 2007. Recovery of gallium and vanadium from gasification fly ash. J. Hazard Mater. 139, 413e423.
Ford, K.L., Beyer, W.N., 2014. Soil criteria to protect terrestrial wildlife and openrange livestock from metal toxicity at mining sites. Environ. Monit. Assess. 186, 1899e1905.
Freer, M., Moore, A., Donnelly, J., 2012. The GRAZPLAN Animal Biology Model for Sheep and Cattle and the GrazFeed Decision Support Tool. CSIRO, Canberra. Available at: http://www.grazplan.csiro.au.
Gustafsson, J., 2013. Visual MINTEQ, Version 3.1 Division of Land and Water Resources. Royal Institute of Technology, Stockholm, Sweden.
Ha, N.N., Agusa, T., Ramu, K., Tu, N.P.C., Murata, S., Bulbule, K.A., Parthasaraty, P., Takahashi, S., Subramanian, A., Tanabe, S., 2009. Contamination by trace elements at e-waste recycling sites in Bangalore, India. Chemosphere 76, 9e15.
Ha, N.T.H., Sakakibara, M., Sano, S., Nhuan, M.T., 2011. Uptake of metals and metalloids by plants growing in a leadezinc mine area, Northern Vietnam. J. Hazard Mater. 186, 1384e1391.
Homma, T., Ueno, T., Sekizawa, K., Tanaka, A., Hirata, M., 2003. Interstitial pneumonia developed in a worker dealing with particles containing indium-tin oxide. J. Occup. Health 45, 137e139.
Horst, W.J., Wang, Y.X., Eticha, D., 2010. The role of the root apoplast in aluminiuminduced inhibition of root elongation and in aluminium resistance of plants: a review. Ann. Bot. 106, 185e197.
Hou, A., Takamatsu, T., Koshikawa, M.K., Hosomi, M., 2005. Migration of silver, indium, tin, antimony, and bismuth and variations in their chemical fractions on addition to uncontaminated soils. Soil Sci. 170, 624e639.
Ivanoff, C.S., Ivanoff, A.E., Hottel, T.L., 2012. Gallium poisoning: a rare case report. Food Chem. Toxicol. 50, 212e215.
Jaitz, L., Mueller, B., Koellensperger, G., Huber, D., Oburger, E., Puschenreiter, M., Hann, S., 2011. LCeMS analysis of low molecular weight organic acids derived from root exudation. Anal. Bioanal. Chem. 400, 2587e2596.
Kabata-Pendias, A., Mukherjee, A.B., 2007. Trace Elements from Soil to Human. Springer Science & Business Media.
Kjølholt, J., Stuer-Lauridsen, F., Mogensen, A.S., Havelund, S., 2003. The Elements in the Second Rank.
Kopittke, P.M., McKenna, B.A., Blamey, F.P.C., Wehr, J.B., Menzies, N.W., 2009. Metalinduced cell rupture in elongating roots is associated with metal ion binding strengths. Plant Soil 322, 303e315. Ladenberger, A., Demetriades, A., Reimann, C., Birke, M., Sadeghi, M., Uhlback, J.,
Andersson, M., Jonsson, E., Team, G.P., 2015. GEMAS: indium in agricultural and grazing land soil of Europe - its source and geochemical distribution patterns. J. Geochem. Explor. 154, 61e80.
Landcare Research, 2018. Brow_6a.1 and Kauae_7a.1 S-map Soil Factsheets.
Li, Z., Ma, T., Yuan, C., Hou, J., Wang, Q., Wu, L., Christie, P., Luo, Y., 2016. Metal contamination status of the soil-plant system and effects on the soil microbial community near a rare metal recycling smelter. Environ. Sci. Pollut. Control Ser. 23, 17625e17634.
Lokanc, M., Eggert, R., Redlinger, M., 2015. The Availability of Indium: the Present, Medium Term, and Long Term. National Renewable Energy Lab. (NREL), Golden, CO (United States).
Lu, F., Xiao, T., Lin, J., Ning, Z., Long, Q., Xiao, L., Huang, F., Wang, W., Xiao, Q., Lan, X., 2017. Resources and extraction of gallium: a review. Hydrometallurgy 174, 105e115.
Maneesuwannarat, S., Vangnai, A.S., Yamashita, M., Thiravetyan, P., 2016. Bioleaching of gallium from gallium arsenide by Cellulosimicrobiurn funkei and its application to semiconductor/electronic wastes. Process Saf. Environ. Protect. 99, 80e87.
Mauseth, J.D., 2014. Botany: an Introduction to Plant Biology. Jones & Bartlett Publishers.
McLaren, R.G., Cameron, K.C.D., 1996. In: New (Ed.), Soil Science: Sustainable Production and Environmental Protection. Oxford University Press, Auckland [N.Z.]. Ministry of Health, 2008. Drinking-water Standards for New Zealand 2005 (Revised 2008). Ministry of Health Wellington.
Oguchi, M., Murakami, S., Sakanakura, H., Kida, A., Kameya, T., 2011. A preliminary categorization of end-of-life electrical and electronic equipment as secondary metal resources. Waste Manag. 31, 2150e2160.
Omberg, L.-G., Borgiel, M., Grolander, S., Norden,� S., 2011. Solid/liquid Partition Coefficients (Kd) and Plant/soil Concentration Ratios (CR) for Selected Soils, Tills and Sediments at Forsmark. Pokrovski, G.S., Diakonov II, Benezeth, P., Gurevich, V.M., Gavrichev, K.S., Gorbunov, V.E., Dandurand, J.L., Schott, J., Khodakovsky, I.L., 1997. Thermodynamic properties of gallium hydroxide oxide (alpha-GaOOH) at temperatures to 700 K. Eur. J. Mineral 9, 941e951.
Połedniok, J., 2008. Speciation of scandium and gallium in soil. Chemosphere 73, 572e579.
Połedniok, J., Kita, A., Zerzucha, P., 2012. Spectrophotometric and inductively coupled plasmaeoptical emission spectroscopy determination of gallium in natural soils and soils polluted by industry: relationships between elements. Commun. Soil Sci. Plant Anal. 43, 1121e1135.
Qin, S., Sun, Y., Li, Y., Wang, J., Zhao, C., Gao, K., 2015. Coal deposits as promising alternative sources for gallium. Earth Sci. Rev. 150, 95e101.
Robinson, B.H., 2009. E-waste: an assessment of global production and environmental impacts. Sci. Total Environ. 408, 183e191.
Schwarz-Schampera, U., 2014. Indium. Critical Metals Handbook, pp. 204e229.
Shaheen, S.M., Tsadilas, C.D., Rinklebe, J., 2013. A review of the distribution coefficients of trace elements in soils: influence of sorption system, element characteristics, and soil colloidal properties. Adv. Colloid Interface Sci. 201, 43e56.
Shannon, R.D., 1976. Revised effective ionic-radii and systematic studies of interatomic distances in halides and chalcogenides. Acta Crystallogr. A 32, 751e767. Sharma, B., Sarkar, A., Singh, P., Singh, R.P., 2017. Agricultural utilization of biosolids: a review on potential effects on soil and plant grown. Waste Manag. 64, 117e132.
Sheppard, M.I., Sheppard, S.C., Grant, C.A., 2007. Solid/liquid partition coefficients to model trace element critical loads for agricultural soils in Canada. Can. J. Soil Sci. 87, 189e201.
Sheppard, S., Long, J., Sanipelli, B., Sohlenius, G., 2009. Solid/liquid Partition Coefficients (Kd) for Selected Soils and Sediments at Forsmark and Laxemarsimpevarp. Svensk karnbr€ anslehantering€ (SKB).
Shiller, A.M., Frilot, D.M., 1996. The geochemistry of gallium relative to aluminum in Californian streams. Geochem. Cosmochim. Acta 60, 1323e1328. Sohlenius, G., Saetre, P., Norden, S., Grolander, S., Sheppard, S., 2013. Inferences about radionuclide mobility in soils based on the solid/liquid partition coefficients and soil properties. Ambio 42, 414e424.
Staff, K., Brown, M.B., Hider, R.C., Kong, X.L., Friden, P., Jones, S.A., 2010. Recovering Ga(III) from coordination complexes using pyridine 2,6-dicarboxylic acid chelation ion chromatography. Biomed. Chromatogr. 24, 1015e1022.
Sterckeman, T., Douay, F., Proix, N., Fourrier, H., Perdrix, E., 2002. Assessment of the contamination of cultivated soils by eighteen trace elements around smelters in the North of France. Water Air Soil Pollut. 135, 173e194.
Su, J.Y., Syu, C.H., Lee, D.Y., 2018. Growth inhibition of rice (Oryza saliva L.) seedlings in Ga- and In-contaminated acidic soils is respectively caused by Al and Al plus in toxicity. J. Hazard Mater. 344, 274e282.
Syu, C.H., Chien, P.H., Huang, C.C., Jiang, P.Y., Juang, K.W., Lee, D.Y., 2017. The growth and uptake of Ga and in of rice (Oryza sative L.) seedlings as affected by Ga and in concentrations in hydroponic cultures. Ecotoxicol. Environ. Saf. 135, 32e39.
Tessier, A., Campbell, P.G.C., Bisson, M., 1979. Sequential extraction procedure for the speciation of particulate trace-metals. Anal. Chem. 51, 844e851.
Tokumaru, T., Ozaki, H., Onwona-Agyeman, S., Ofosu-Anim, J., Watanabe, I., 2017. Determination of the Extent of Trace Metals Pollution in Soils, Sediments and Human Hair at e-Waste Recycling Site in Ghana. Arch. Environ. Contam. Toxicol. 73, 377e390.
Tyler, G., 2004. Ionic charge, radius, and potential control root/soil concentration ratios of fifty cationic elements in the organic horizon of a beech (Fagus
sylvatica) forest podzol. Sci. Total Environ. 329, 231e239.
Tyler, G., 2005. Changes in the concentrations of major, minor and rare-earth elements during leaf senescence and decomposition in a Fagus sylvatica forest. For. Ecol. Manag. 206, 167e177.
Tyler, G., Olsson, T., 2001. Concentrations of 60 elements in the soil solution as related to the soil acidity. Eur. J. Soil Sci. 52, 151e165.
Tyler, G., Olsson, T., 2002. Conditions related to solubility of rare and minor elements in forest soils. Journal of Plant Nutrition and Soil Science-Zeitschrift Fur Pflanzenernahrung Und Bodenkunde 165, 594e601.
U.S. Geological Survey, 2017a. Gallium statistics [through 2015; last modified January 19, 2017]. U.S. Geological Survey Data Series 140. In: Kelly, T., Matos, G. (Eds.), Historical Statistics for Mineral and Material Commodities in the United States. US Geological Survey.
U.S. Geological Survey, 2017b. Indium statistics [through 2015; last modified January 19, 2017]. U.S. Geological Survey Data Series 140. In: Kelly, T., Matos, G. (Eds.), Historical Statistics for Mineral and Material Commodities in the United States. US Geological Survey.
Valentinuzzi, F., Mimmo, T., Cesco, S., Al Mamun, S., Santner, J., Hoefer, C., Oburger, E., Robinson, B., Lehto, N., 2015. The effect of lime on the rhizosphere processes and elemental uptake of white lupin. Environ. Exp. Bot. 118, 85e94.
Waterlot, C., Bidar, G., Pelfrene, A., Roussel, H., Fourrier, H., Douay, F., 2013. Contamination, fractionation and availability of metals in urban soils in the vicinity of former lead and zinc smelters, France. Pedosphere 23, 143e159.
Watmough, S.A., 2008. Element mobility and partitioning along a soil acidity gradient in central Ontario forests, Canada. Environ. Geochem. Health 30, 431e444.
Wheeler, D., Power, I., 1995. Comparison of plant uptake and plant toxicity of various ions in wheat. Plant Soil 172, 167e173.
White, S.J.O., Hemond, H.F., 2012. The anthrobiogeochemical cycle of indium: a review of the natural and anthropogenic cycling of indium in the environment. Crit. Rev. Environ. Sci. Technol. 42, 155e186.
Wood, S.A., Samson, I.M., 2006. The aqueous geochemistry of gallium, germanium, indium and scandium. Ore Geol. Rev. 28, 57e102.
Yu, X.Z., Feng, X.H., Feng, Y.X., 2015. Phytotoxicity and transport of gallium (Ga) in rice seedlings for 2-day of exposure. Bull. Environ. Contam. Toxicol. 95, 122e125.
Zhang, F.-S., Yamasaki, S., Kimura, K., 2002. Waste ashes for use in agricultural production: II. Contents of minor and trace metals. Sci. Total Environ. 286, 111e118.