Contents lists available at ScienceDirect journal homepage: www.elsevier.com/locate/scitotenv
Jo-Anne E. Cavanagh a,⁎, Z. Yi b, C.W. Gray c, K. Munir a, N. Lehto b, B.H. Robinson a,1
a Manaaki Whenua – Landcare Research, Gerald Street, PO Box 69040, Lincoln 7640, New Zealand b Faculty of Agricultural and Life Sciences, Lincoln University, PO Box 7647, Lincoln 7647, New Zealand c AgResearch, Lincoln Research Centre, Private Bag, Christchurch 4749, New Zealand
a Manaaki Whenua – Landcare Research,Gerald Street,PO Box 69040,Lincoln 7640,新西兰 b 林肯大学农业与生命科学学院,PO Box 7647,Lincoln 7647,新西兰 c AgResearch,Lincoln Research Centre,Private Bag,基督城 4749,新西兰
H I G H L I G H T S
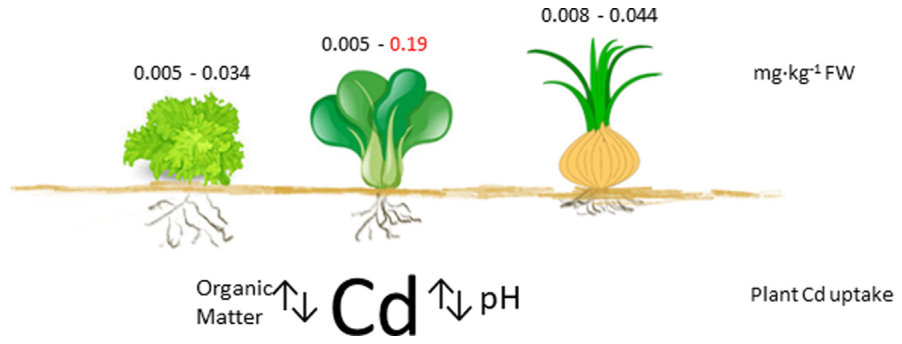
G R A P H I C A L A B S T R A C T
- Variation of Cd in lettuce types or onion cultivars was inconsistent across sites.不同生菜类型或洋葱品种间Cd含量的差异在各采样点之间不一致。
- Soil Cd concentration, pH and region significantly predicted Cd in onions.土壤Cd浓度、pH和地区可显著预测洋葱中的Cd含量。
- Soil Cd concentration and carbon significantly predicted Cd in bunching spinach.土壤Cd浓度和碳含量可显著预测成熟菠菜中的Cd含量。
- The soil Cd concentration range was limited, typically between 0.07 and 0.8 mg kg−1.土壤Cd浓度范围有限,通常介于0.07~0.8 mg kg−1之间。
- Soil-plant relationships explained only a low-moderate proportion of Cd in plants.土壤–植物关系仅能解释植物Cd含量变异中低至中等的比例。
a r t i c l e i n f o
a b s t r a c t
Article history: Received 12 November 2018 Received in revised form 1 March 2019 Accepted 1 March 2019 Available online 2 March 2019
Editor: Charlotte Poschenrieder
Keywords: Cadmium uptake Cultivar Onion Spinach Plant–soil relationship
关键词:镉吸收;品种;洋葱;菠菜;植物–土壤关系
Paired soil and plant samples collected from the main commercial growing areas for onions (Allium cepa), lettuce (Lactuca sativa) and spinach (Spinacia olearacea) in New Zealand were used to assess the influence of plant and soil factors on cadmium (Cd) uptake in these crops. Differences in Cd concentration between eight lettuce sub-types were not consistent across sites, nor were differences in Cd concentrations in three crisphead cultivars assessed at two sites. Similarly, differences in Cd concentrations between four onion cultivars were inconsistent across sites. Mean lettuce Cd concentrations in eight lettuce varieties (range 0.005–0.034 mg∙kg−1 (fresh weight, FW) were markedly lower than those in baby leaf and bunching spinach, (range 0.005–0.19 mg∙kg−1 FW). Significant regional variation was observed in Cd concentrations in one onion cultivar (mean range 0.007–0.05 mg∙kg−1 FW). Soil Cd concentration, pH and region were statistically significant predictors of onion Cd concentration, explaining low (38% for soil Cd and pH) to moderate (50% for all three parameters) percentage of the variation. Soil Cd concentration and exchangeable magnesium or total carbon were statistically significant predictors of Cd concentration in baby leaf and bunching spinach, respectively, explaining a moderate percentage (49% and 42%) of the variation in Cd concentration. Increasing pH and soil carbon may assist in minimising Cd uptake in onion and bunching spinach, respectively. The low to moderate proportion of explained variation is partly attributable to the narrow range in some measured soil properties and indicates factors other than those assessed are influencing plant uptake. This highlights a challenge in using these relationships to develop risk-based soil guideline values to support compliance with food standards. Similarly, the inconsistency in Cd concentrations in different cultivars across sites highlights the need for multi-site assessments to confirm the low Cd accumulation status of different cultivars.
本研究利用在新西兰洋葱(Allium cepa)、生菜(Lactuca sativa)和菠菜(Spinacia olearacea)主要商业种植区采集的配对土壤和植物样品,评估了植物和土壤因素对上述作物镉(Cd)吸收的影响。8种生菜亚型之间的Cd浓度差异在各采样点间并不一致,在2个采样点评估的3个结球生菜品种之间的Cd浓度差异亦不一致。同样,4个洋葱品种之间的Cd浓度差异在各采样点间也不一致。8个生菜品种的平均Cd浓度(范围0.005–0.034 mg∙kg−1(鲜重,FW))明显低于嫩叶菠菜和成熟菠菜(范围0.005–0.19 mg∙kg−1 FW)。1个洋葱品种的Cd浓度存在显著的地区差异(平均值范围0.007–0.05 mg∙kg−1 FW)。土壤Cd浓度、pH和地区是洋葱Cd浓度的统计学显著预测因子,可解释低(土壤Cd和pH为38%)至中等(三个参数合计为50%)比例的变异。土壤Cd浓度与交换性镁或全碳分别是嫩叶菠菜和成熟菠菜Cd浓度的统计学显著预测因子,可解释中等比例(49%和42%)的Cd浓度变异。提高pH和土壤碳含量可能分别有助于降低洋葱和成熟菠菜对Cd的吸收。可解释变异比例低至中等,部分归因于某些所测土壤性质的范围较窄,同时表明除所评估因素之外的其他因素也在影响植物吸收。这凸显了利用这些关系制定基于风险的土壤指导值以支持符合食品标准所面临的挑战。同样,不同品种Cd浓度在各采样点间的不一致性表明,需要开展多点评估,以确认不同品种的低Cd积累特性。
© 2019 Published by Elsevier B.V.
⁎ Corresponding author.
E-mail address: cavanaghj@landcareresearch.co.nz (J.-A.E. Cavanagh).
1 Current address School of Physical and Chemical Sciences, University of Canterbury, Private Bag 4800, Christchurch 8140, New Zealand.
1Introduction引言
Plant uptake of cadmium (Cd) from soil is a key factor affecting food chain transfer. The uptake of Cd by plants is influenced by a number of factors, including crop species and cultivar (e.g. Alexander et al., 2006; Guttieri et al., 2015; Sghayar et al., 2015), and the use of low-Cdaccumulating cultivars provides one means to manage Cd in food crops (e.g. Grant et al., 2008; Zhang et al., 2013). Soil properties, including pH, organic matter, salinity, cation-exchange capacity (CEC), clay content, availability of macronutrients, and micronutrients such as zinc (Zn), also influence Cd uptake in plants (e.g. Chaney, 2012; de Meeus et al., 2002; Golia et al., 2008; Grant and Bailey, 1998; McBride, 2002). Identified relationships between soil properties and plant uptake can be used as the basis for setting soil guideline values intended to ensure that human health is protected when home-grown produce is consumed, and intended to support food standards being met (de Vries et al., 2007; de Vries and McLaughlin, 2013; Romkens et al., 2009, 2011; Smolders et al., 2008; Swartjes, 2007; Yang et al., 2016). Further, these relationships can indicate the likely efficacy of potential management options for reducing plant uptake of Cd; so far pH management (through lime addition) and the addition of organic matter (as compost) are most common (e.g. Bolan and Duraisamy, 2003; Kumarpandit et al., 2017).
植物从土壤中吸收镉(Cd)是影响其在食物链中传递的关键因素。植物对Cd的吸收受多种因素影响,包括作物种类和品种(如Alexander et al., 2006; Guttieri et al., 2015; Sghayar et al., 2015),而使用低Cd积累品种是管理粮食作物中Cd的途径之一(如Grant et al., 2008; Zhang et al., 2013)。土壤性质,包括pH、有机质、盐度、阳离子交换量(CEC)、黏粒含量、大量营养元素的有效性以及锌(Zn)等微量营养元素,也会影响植物对Cd的吸收(如Chaney, 2012; de Meeus et al., 2002; Golia et al., 2008; Grant and Bailey, 1998; McBride, 2002)。已确定的土壤性质与植物吸收之间的关系可作为制定土壤指导值的依据,其目的在于确保食用自家种植的农产品时人体健康得到保护,并支持食品标准的达成(de Vries et al., 2007; de Vries and McLaughlin, 2013; Romkens et al., 2009, 2011; Smolders et al., 2008; Swartjes, 2007; Yang et al., 2016)。此外,这些关系还可指示降低植物Cd吸收的潜在管理措施可能的效果;迄今为止,最常见的措施是pH管理(通过施用石灰)和添加有机质(以堆肥形式)(如Bolan and Duraisamy, 2003; Kumarpandit et al., 2017)。
There is concern worldwide regarding the accumulation of Cd in agricultural soils, particularly in relation to the potential adverse effect Cd can have on food quality, leading to dietary or trade risks where food standards are not met (EFSA, 2011; Lin et al., 2015; Rizwan et al., 2017; Toth et al., 2016). In New Zealand a strategy for managing the risks of Cd to agriculture and horticulture has been in place since 2011 (MAF, 2011). The strategy aims to “ensure that cadmium in rural production poses minimal risks to health, trade, land use flexibility and the environment over the next 100 years”. A key component of the strategy is the Tiered Fertiliser Management System (TFMS), which comprises five tiers and four trigger concentrations to minimise Cd accumulation in soil by imposing increasingly stringent fertiliser management practices as Cd concentrations increase.
农业土壤中Cd的积累已引起全球关注,特别是Cd可能对食品质量产生不利影响,在不符合食品标准时导致膳食或贸易风险(EFSA, 2011; Lin et al., 2015; Rizwan et al., 2017; Toth et al., 2016)。新西兰自2011年起实施了一项管理Cd对农业和园艺风险的战略(MAF, 2011)。该战略旨在“确保在未来100年内,农村生产中的镉对健康、贸易、土地利用灵活性和环境构成的风险最小”。该战略的一个关键组成部分是分级肥料管理系统(TFMS),其包含5个等级和4个触发浓度,随着Cd浓度的升高实施日益严格的肥料管理措施,以尽量减少Cd在土壤中的积累。
However, the trigger values are interim given a lack of New Zealandspecific data on soil Cd concentrations that may pose a risk for local agricultural systems and how these risks might be managed (MAF, 2011). Soil Cd concentrations to support compliance with food standards may often be lower than soil Cd concentrations causing detrimental effects on ecological receptors, including plants and soil biota (Cavanagh, 2013; de Vries et al., 2007; MPI, 2012). Furthermore, food standards have previously been reported to have been occasionally exceeded in potatoes (Kim, 2005) and wheat grown in New Zealand (Gray et al., 2001), and our other papers discuss soil and plant factors influencing Cd uptake in these crops (Gray et al., accepted-a, accepted-b).
然而,由于缺乏新西兰本国关于可能对本地农业系统构成风险的土壤Cd浓度及如何管理这些风险的数据,这些触发值仅为暂定值(MAF, 2011)。为支持符合食品标准所需的土壤Cd浓度,往往低于对包括植物和土壤生物在内的生态受体产生不利影响的土壤Cd浓度(Cavanagh, 2013; de Vries et al., 2007; MPI, 2012)。此外,已有报道指出新西兰种植的马铃薯(Kim, 2005)和小麦(Gray et al., 2001)偶有超出食品标准的情况,我们的其他论文讨论了影响这些作物Cd吸收的土壤和植物因素(Gray et al., accepted-a, accepted-b)。
Onions (Allium cepa) are one of the highest-value export crops for New Zealand, valued at $112 million in 2017 (Plant and Food Research, 2017). There are few studies on Cd uptake by onions, possibly because Cd concentrations in onions are relatively low and they represent a small contribution to dietary intake (e.g. EFSA, 2012; Pearson et al., 2018). However, regulatory maximum levels (MLs) established for onions are also low (e.g. 0.05 mg∙kg−1 FW, Codex, 2018, EC, 2006), arguably leading to a greater potential for these to be exceeded. For example, in 2016 five shipments of US onions were rejected at the Taiwanese border due to non-compliance with Taiwan's food safety standards for Cd of 0.05 mg∙kg−1 FW.2
洋葱(Allium cepa)是新西兰价值最高的出口作物之一,2017年出口额达1.12亿美元(Plant and Food Research, 2017)。关于洋葱Cd吸收的研究较少,这可能是由于洋葱中Cd浓度相对较低,且其对膳食摄入的贡献很小(如EFSA, 2012; Pearson et al., 2018)。然而,针对洋葱设定的法定最大限量(ML)同样较低(如0.05 mg∙kg−1 FW,Codex, 2018,EC, 2006),因此可以认为其被超出的可能性更大。例如,2016年有5批美国洋葱因不符合台湾Cd食品安全标准0.05 mg∙kg−1 FW而在台湾口岸被拒绝入境。2
Leafy green vegetables such as lettuce (Lactuca sativa) and spinach (Spinacia olearacea), which typically accumulate significantly more Cd in their edible parts than other vegetables (Alexander et al., 2006; Baldantoni et al., 2016; He and Singh, 1994), potentially provide a sensitive indicator for assessing the risk posed by soil Cd in relation to compliance with food standards. Numerous studies have assessed Cd uptake in lettuce, with some also assessing variations between cultivars (Alexander et al., 2006; Li et al., 2014; Zhang et al., 2013). Fewer studies report on the variation in Cd uptake by different lettuce ‘types’, with lettuce generally grouped into crisphead, buttterhead or buttercrunch, romaine/cos, and loose-leaf types. Crews and Davies (1985) identified that crisphead lettuce, which comprises the bulk of New Zealand lettuce production, had lower Cd concentrations compared with three other lettuce types. Spinach, as baby-leaf (immature spinach) or bunching (mature) spinach, is a widely consumed leafy green vegetable, globally as well as in New Zealand, and it is frequently identified as one of the highest Cd accumulating vegetables (e.g. Lin et al., 2015).
生菜(Lactuca sativa)和菠菜(Spinacia olearacea)等叶菜类蔬菜的可食部分通常比其他蔬菜积累显著更多的Cd(Alexander et al., 2006; Baldantoni et al., 2016; He and Singh, 1994),因此可能为评估土壤Cd对食品标准合规性构成的风险提供灵敏的指示。已有大量研究评估了生菜的Cd吸收,其中一些还评估了品种间的差异(Alexander et al., 2006; Li et al., 2014; Zhang et al., 2013)。关于不同生菜“类型”间Cd吸收差异的报道较少,生菜通常分为结球型、奶油型(或脆奶油型)、罗马/直立型和散叶型。Crews and Davies(1985)发现,占新西兰生菜产量大部分的结球生菜,其Cd浓度低于其他三种生菜类型。菠菜以嫩叶(未成熟)菠菜或成熟菠菜的形式,在全球以及新西兰都是消费广泛的叶菜类蔬菜,且常被认为是Cd积累最高的蔬菜之一(如Lin et al., 2015)。
The objectives of this study were to (i) determine the baseline concentrations of Cd in onions, lettuce and spinach grown in the main commercial growing areas in New Zealand, and (ii) assess the influence of plant and soil factors on Cd uptake in these crops to inform management strategies, including the development of risk-based soil guideline values, to support compliance with regulatory food quality standards.
本研究的目的是:(i)确定新西兰主要商业种植区所产洋葱、生菜和菠菜中Cd的基线浓度;(ii)评估植物和土壤因素对上述作物Cd吸收的影响,为管理策略(包括制定基于风险的土壤指导值)提供依据,以支持符合法定食品质量标准。
2Methods方法
2.1. Sites and sampling2.1. 采样点与采样
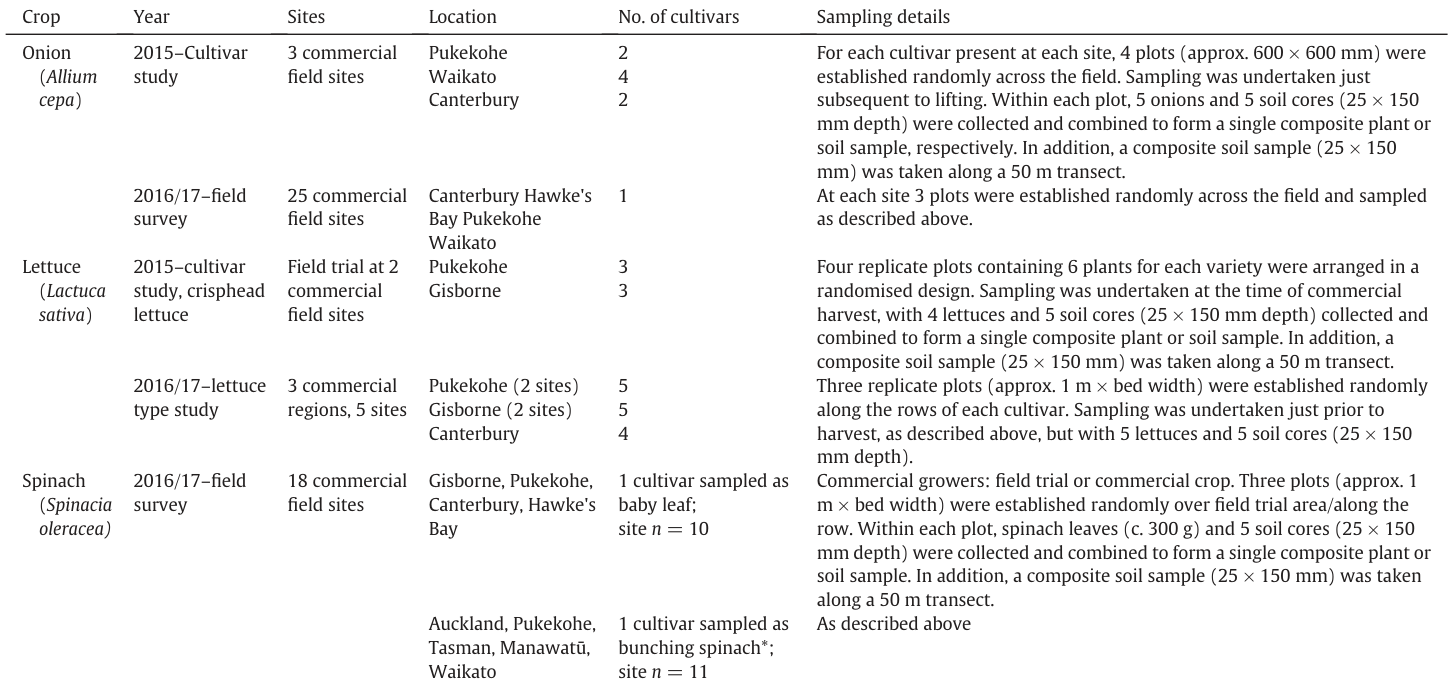
Cultivars selected for sampling were those identified by industry grower groups as commonly grown in New Zealand. Onions were all sampled from commercial crops. Cadmium concentrations were determined in four onion cultivars (Rhinestone [BV1], Plutonis [BV2], RLK-X1 [BV3], and Red [RV1]) grown across three sites in 2015, and in one onion cultivar (Rhinestone) grown across 25 additional sites over 2016/17. Leafy greens were sampled from commercial crops, where possible, with seed for specific cultivars provided to other growers and grown as field trials at additional commercial sites. For lettuce, Cd concentrations were determined in three crisphead (Iceberg) cultivars (Constanza [V1], Icegreen [V2] and Vegas [V3]), grown at two sites in 2015, and in three lettuce types (eight lettuce sub-types) (loose-leaf: Red Frill [FR], Green Frill [GF]; romaine/cos: Green Cos [GC], Red Cos [CR), Baby Cos [BC]; crisphead: Iceberg [IB]), grown across five sites in 2016/17. Cadmium concentrations were determined in one spinach cultivar (Jedi) sampled across 18 sites in 2016/17, with two additional spinach cultivars (Black Glove, Nightfall) sampled from one site on separate occasions. Sampling details are summarised in Table 1, and general locations are shown in Fig. A.1.
采样品种为行业种植者团体认定在新西兰普遍种植的品种。洋葱均采自商业作物。2015年测定了在3个采样点种植的4个洋葱品种(Rhinestone [BV1]、Plutonis [BV2]、RLK-X1 [BV3]和Red [RV1])的Cd浓度,并于2016/17年测定了在另外25个采样点种植的1个洋葱品种(Rhinestone)的Cd浓度。叶菜类尽可能采自商业作物,并向其他种植者提供特定品种的种子,在另外的商业种植点以田间试验形式种植。对于生菜,2015年测定了在2个采样点种植的3个结球(Iceberg)品种(Constanza [V1]、Icegreen [V2]和Vegas [V3])的Cd浓度;2016/17年测定了在5个采样点种植的3种生菜类型(8种生菜亚型)(散叶型:Red Frill [FR]、Green Frill [GF];罗马/直立型:Green Cos [GC]、Red Cos [CR]、Baby Cos [BC];结球型:Iceberg [IB])的Cd浓度。2016/17年测定了在18个采样点采集的1个菠菜品种(Jedi)的Cd浓度,另有2个菠菜品种(Black Glove、Nightfall)在1个采样点分不同批次采集。采样详情汇总于表1,大致位置见图A.1。
2.2. Soil and plant analysis2.2. 土壤与植物分析
Soils were oven-dried (35 °C) until a constant weight obtained and sieved (b2 mm) before analysis. Soil pH was determined in a 1:2 soil: water solution by potentiometric analysis (Blakemore et al., 1987). Exchangeable potassium (K), calcium (Ca), magnesium (Mg) and sodium (Na) were measured in a 1 M neutral ammonium acetate extract (Blakemore et al., 1987), and analysed by Inductively-Coupled Plasma Optical Emission Spectrometry (ICP-OES; Varian 720 ES- USA). Cation Exchange Capacity (CEC) was calculated by summing concentrations of extractable cations and extractable acidity. Bioavailable phosphorous (P as Olsen P) was determined by bicarbonate extraction (Olsen, 1954). Total carbon (C) and nitrogen (N) were determined by combustion using an Elementar Vario-Max CN elemental analyser. Extractable chloride concentrations were measured in a filtered 1:5 soil:water extract by ion chromatography. (Dionex ICS-2100, Thermo Fisher Scientific Inc.). Total extractable concentrations of Cd, Zn, P, aluminium (Al) and iron (Fe) were determined by microwave digestion (MARSXPRESS, CEM Corp.), using nitric acid and hydrogen peroxide as described by Simmler et al. (2013). The digests were analysed by Inductively- Coupled Plasma Mass Spectrometry (ICP-MS; Agilent 7500cx) for Zn, P, Al and Fe. Particle size analysis was measured using the pipette method (Claydon, 1989).
土壤样品在35 °C下烘干至恒重,过筛(<2 mm)后进行分析。土壤pH采用电位法在1:2土水比溶液中测定(Blakemore et al., 1987)。交换性钾(K)、钙(Ca)、镁(Mg)和钠(Na)采用1 M中性乙酸铵浸提(Blakemore et al., 1987),并用电感耦合等离子体发射光谱仪(ICP-OES;Varian 720 ES- USA)测定。阳离子交换量(CEC)由可提取阳离子浓度与可提取酸度之和计算得出。有效磷(以Olsen P表示)采用碳酸氢盐浸提法测定(Olsen, 1954)。全碳(C)和全氮(N)采用Elementar Vario-Max CN元素分析仪燃烧法测定。可提取氯化物浓度采用离子色谱法(Dionex ICS-2100,Thermo Fisher Scientific Inc.)测定经过滤的1:5土水浸提液。Cd、Zn、P、铝(Al)和铁(Fe)的总可提取浓度按Simmler et al.(2013)所述方法,采用硝酸和过氧化氢微波消解(MARSXPRESS,CEM Corp.)测定。消解液中Zn、P、Al和Fe采用电感耦合等离子体质谱仪(ICP-MS;Agilent 7500cx)测定。颗粒组成采用吸管法测定(Claydon, 1989)。
Summary of sites and details of soil and plant sampling.
采样点概况及土壤与植物采样详情。
Onion roots, leaves and outer skin were removed, and the remaining bulb weighed, dried at 60 °C to a constant weight, and weighed again to enable reporting of data on a fresh weight (FW) basis. Lettuce and spinach leaves were washed and excess water removed, weighed, dried at 60 °C to a constant weight, and weighed again to enable reporting of data on a fresh weight (FW) basis. Plant samples were ground and digested by microwave digestion in nitric acid and hydrogen peroxide using the method described by Cindric et al. (2015) prior to analysis of the digests by ICP-MS. Plant concentration data are expressed as fresh weight concentrations unless otherwise specified.
去除洋葱的根、叶和外皮后,称量剩余鳞茎,于60 °C下烘干至恒重后再次称量,以便以鲜重(FW)为基础报告数据。生菜和菠菜叶片经清洗并去除多余水分后称重,于60 °C下烘干至恒重后再次称量,以便以鲜重(FW)为基础报告数据。植物样品经粉碎后,按Cindric et al.(2015)所述方法用硝酸和过氧化氢微波消解,消解液用ICP-MS分析。除另有说明外,植物浓度数据均以鲜重浓度表示。
2.3. Quality control/assurance2.3. 质量控制/质量保证
Soil and plant samples were digested in batches of up to 40. Each batch included at least one digestion (procedural) blank. One out of every 20 samples was analysed in duplicate to confirm repeatability of the analysis. Cadmium concentrations in procedural blanks were used to estimate the method detection limit and duplicate analysis of samples were within 5% of each other. The accuracy of soil and plant analysis was assessed using several internal and external certified reference materials including for soil (NIST Montana 2711; Interlab internal WEPAL soil 921; Interlab internal WEPAL soil 981), and plant (NIST 1573a, tomato leaves; ASPAC internal clover; ASPAC internal beetroot). Analytical results were within 5% of the certified values. The method detection limits were 0.020 mg kg−1 and 0.005 mg kg−1 in soil and plant material on a dry weight basis, respectively.
土壤和植物样品以每批最多40个进行消解。每批至少包含1个消解(流程)空白。每20个样品中有1个进行平行分析,以确认分析的重复性。利用流程空白中的Cd浓度估算方法检出限,样品平行分析结果相差在5%以内。采用多种内部和外部有证标准物质评估土壤和植物分析的准确性,其中土壤包括NIST Montana 2711、Interlab内部WEPAL土壤921和Interlab内部WEPAL土壤981,植物包括NIST 1573a(番茄叶)、ASPAC内部三叶草和ASPAC内部甜菜根。分析结果与认定值相差在5%以内。以干重计,土壤和植物材料的方法检出限分别为0.020 mg kg−1和0.005 mg kg−1。
We also calculated the plant uptake factors (PUF) (Eq. (2)) a commonly used, simple measure of plant uptake of inorganic contaminants.
我们还计算了植物吸收因子(PUF)(式(2)),这是一种常用的、衡量植物对无机污染物吸收的简单指标。

Soil Cd concentrations at which specific concentrations occur in a given cultivar can be back-calculated from Eq. (1) (e.g. de Vries et al., 2007, Romkens et al., 2009, 2011) or by rearrangement of Eq. (2) yielding Eq. (3), assuming conditions such as soil properties do not change. Using the ML as the target plant concentration (Cdplant limit), an estimate can be made of the soil concentration at which the food standard may be reached (nCdFS). The food standard is expressed as fresh weight, which requires conversion to a Cd concentration based on dry weight. The dry weight was 10% of the fresh weight for onions, 9% for spinach, 5% for non-iceberg lettuce, and 3% for iceberg lettuce, based on the mean dry matter content for our samples. These values are not intended as threshold limits, but rather provide an insight into soil properties influencing plant uptake and the Cd concentrations at which management to mitigate the risk of exceeding food standards might be considered.
在假定土壤性质等条件不变的情况下,可由式(1)反算(如de Vries et al., 2007, Romkens et al., 2009, 2011),或将式(2)变形得到式(3),从而求得某一品种中出现特定浓度时对应的土壤Cd浓度。以ML作为目标植物浓度(Cdplant limit),可估算达到食品标准时的土壤浓度(nCdFS)。食品标准以鲜重表示,需将其换算为以干重为基础的Cd浓度。根据本研究样品的平均干物质含量,洋葱的干重为鲜重的10%,菠菜为9%,非结球生菜为5%,结球生菜为3%。这些数值并非用作阈值限值,而是为了深入了解影响植物吸收的土壤性质,以及在何种Cd浓度下可考虑采取管理措施以降低超出食品标准的风险。

2.5. Statistical analysis2.5. 统计分析
2.4. Soil–plant relationships2.4. 土壤–植物关系
We assessed the relationship between plant Cd uptake and soil properties using two approaches. Firstly, we tested Freundlich-type regression relationships (Eq. (1)), with significant soil properties identified through multiple linear regression (see ‘Statistical analysis’).
我们采用两种方法评估了植物Cd吸收与土壤性质之间的关系。首先,我们检验了Freundlich型回归关系(式(1)),并通过多元线性回归确定显著的土壤性质(见“统计分析”)。

where Cdplant is the plant Cd concentration (mg kg−1 DW), Cdsoil is the soil Cd concentration (mg kg−1) and C is the soil carbon content (%).
式中,Cdplant为植物Cd浓度(mg kg−1 DW),Cdsoil为土壤Cd浓度(mg kg−1),C为土壤碳含量(%)。
Statistical analyses were performed using R version 3.4.3 (R Core Team, 2016). Multiple linear regression analyses were a primary focus for assessing the relationship between edible plant Cd concentrations (expressed as dry weight) and soil variables using the MASS and leaps packages (Lumley, 2017; Venables and Ripley, 2002). Soil properties varied within sites, so analyses were undertaken using individual plot data (where they were available). Where soil properties were measured only once at a given site (e.g. particle size, extractable chloride concentrations), site average data (i.e. the average of the plots sampled on each site) were used to investigate the relationship of those properties with plant concentration.
统计分析采用R 3.4.3版本(R Core Team, 2016)。主要利用MASS和leaps程序包(Lumley, 2017; Venables and Ripley, 2002)进行多元线性回归分析,以评估可食植物Cd浓度(以干重表示)与土壤变量之间的关系。由于土壤性质在采样点内存在差异,分析采用各小区数据(如有)。对于在某一采样点仅测定一次的土壤性质(如颗粒组成、可提取氯化物浓度),则采用采样点平均数据(即各采样点所采小区的平均值)来研究这些性质与植物浓度之间的关系。
Regional and cultivar differences in plant Cd concentrations (fresh weight basis) were assessed using ANOVA, or using t-tests where only two data sets were compared. Effects were considered significant if they differed at the probability level of 5%, based on Tukey's honest significance difference test (HSD).
采用ANOVA评估植物Cd浓度(以鲜重计)的地区和品种差异,仅比较两组数据时采用t检验。基于Tukey真实显著性差异检验(HSD),在5%概率水平上存在差异时视为显著。
3Results and discussion结果与讨论
3.1. Lettuce – cultivar and type3.1. 生菜——品种与类型
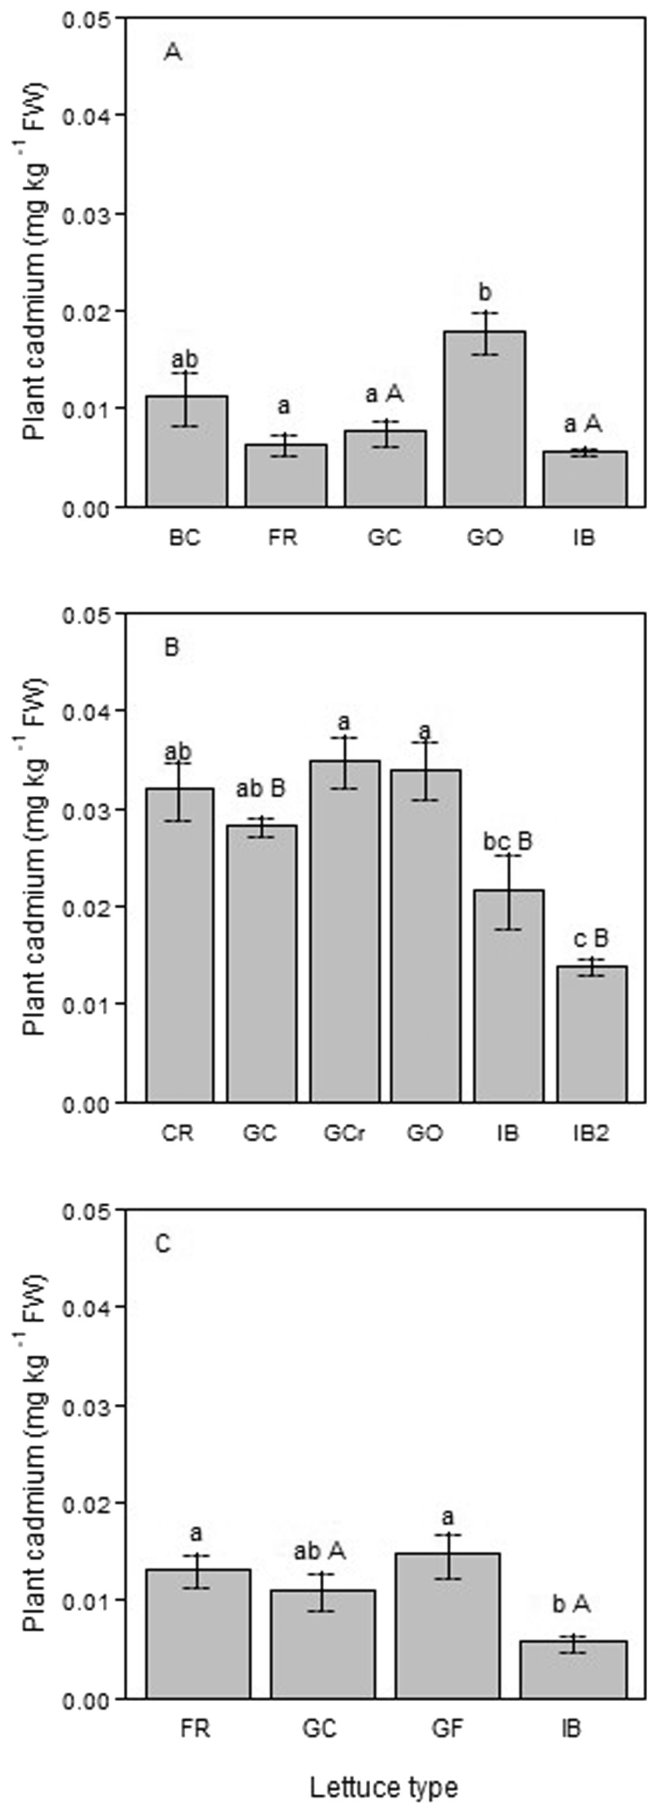
Mean lettuce Cd concentrations2 in three Iceberg cultivars ranged between 0.005 and 0.019 mg∙kg−1 (n = 24) with significantly higher Cd concentrations observed in the Iceberg V1 cultivar compared with that in V2 and V3 cultivars for lettuce grown in Gisborne (Fig. A.2). Given the low Cd concentrations observed in the Iceberg cultivars, a wider range of lettuce types were subsequently sampled. Mean Cd concentrations in all lettuce types ranged between 0.005 and 0.034 mg∙kg−1, with an overall mean of 0.02 (n = 47) (Fig. 1). Significant differences in Cd concentrations in different lettuce varieties grown at the same site in Pukekohe and Canterbury were not consistent across the sites (Fig. 1A, C) and no significant differences in Cd concentrations were observed for lettuce varieties grown at the same site in Gisborne (Fig. 1B). Cadmium concentrations in Iceberg lettuce grown at different sites in Pukekohe and Gisborne were similarly low or lower than concentrations in other lettuce types from those regions (Fig. 1). Similarly, Iceberg lettuce grown in Canterbury had lower concentrations than other lettuces at this site. However, the lower concentrations in Iceberg lettuce may be more attributable to differences in dry matter content (typically 3% for Iceberg lettuce and 5% for other lettuce types), as no significant difference was observed in Cd concentrations expressed on a dry weight basis.
3个Iceberg品种的生菜平均Cd浓度2介于0.005~0.019 mg∙kg−1之间(n = 24),在Gisborne种植的生菜中,Iceberg V1品种的Cd浓度显著高于V2和V3品种(图A.2)。鉴于Iceberg品种中观察到的Cd浓度较低,随后对更多生菜类型进行了采样。所有生菜类型的平均Cd浓度介于0.005~0.034 mg∙kg−1之间,总平均值为0.02(n = 47)(图1)。在Pukekohe和坎特伯雷同一采样点种植的不同生菜品种之间Cd浓度的显著差异在各采样点间并不一致(图1A、C),而在Gisborne同一采样点种植的生菜品种之间未观察到Cd浓度的显著差异(图1B)。在Pukekohe和Gisborne不同采样点种植的Iceberg生菜,其Cd浓度与这些地区其他生菜类型相近或更低(图1)。同样,坎特伯雷种植的Iceberg生菜的浓度也低于该采样点的其他生菜。然而,Iceberg生菜浓度较低可能更多归因于干物质含量的差异(Iceberg生菜通常为3%,其他生菜类型为5%),因为以干重表示时Cd浓度未见显著差异。
Green Cos and Iceberg were the only lettuce grown in all three regions, with significantly higher Cd concentrations observed in lettuce grown in Gisborne compared to those grown in Pukekohe and Canterbury (Fig. 1). Soil Cd concentrations were similarly low in Canterbury (site mean 0.12 mg∙kg−1) and Gisborne (0.14–0.23 mg∙kg−1), with Pukekohe having the highest concentrations (0.52–0.63 mg∙kg−1) (Fig. A.3). Aggregating Cd concentrations from all lettuce samples shows plant uptake of Cd was highest in Gisborne (median PUF: 3.6), followed by Canterbury (median PUF: 2.1), with the lowest uptake occurring in Pukekohe (median PUF: 0.45) (Fig. A.3).
Green Cos和Iceberg是仅有的在三个地区均有种植的生菜,Gisborne种植的生菜Cd浓度显著高于Pukekohe和坎特伯雷种植的生菜(图1)。坎特伯雷(采样点平均值0.12 mg∙kg−1)和Gisborne(0.14–0.23 mg∙kg−1)的土壤Cd浓度同样较低,Pukekohe的浓度最高(0.52–0.63 mg∙kg−1)(图A.3)。汇总所有生菜样品的Cd浓度表明,植物对Cd的吸收以Gisborne最高(PUF中位数:3.6),其次为坎特伯雷(PUF中位数:2.1),Pukekohe最低(PUF中位数:0.45)(图A.3)。
General soil properties for the lettuce sites are shown in Table 2. The mean soil pH across all the sites was close to 7, with all sites except one (IB in Gisborne) having pH N 6. Lettuce (Iceberg) grown at this site had elevated Cd compared to Iceberg lettuce grown at a different site in Gisborne (IB2) with a pH of 6.7 and slightly lower soil Cd (0.15 vs 0.20 mg∙kg−1).
生菜采样点的一般土壤性质见表2。所有采样点的平均土壤pH接近7,除1个采样点(Gisborne的IB)外,其余采样点pH均 > 6。该采样点种植的生菜(Iceberg)Cd含量高于Gisborne另一采样点(IB2)种植的Iceberg生菜,后者pH为6.7,土壤Cd略低(0.15 vs 0.20 mg∙kg−1)。
Mean lettuce Cd concentrations were comparable to concentrations in lettuce from a recent total diet survey (0.4 mg∙kg−1 [DW] (Pearson et al., 2018) or 0.02 mg∙kg−1 [FW]), assuming 5% dry matter;) and Iceberg lettuce sold commercially in the Waikato region (mean: 0.019 mg∙kg−1; n = 11, range 0.004–0.042 mg∙kg−1) (Kim, 2005), and lower than in lettuce from Pukekohe market gardens (mean: 0.04 mg∙kg−1; n = 30, range 0.01–0.14 mg∙kg−1; (Roberts et al., 1995). Cd concentrations in all lettuce types were at the lower end of the range (0.001–0.24 mg∙kg−1) reported in international studies (Baldantoni et al., 2016; Grybauskait et al., 2014; Lin et al., 2015; Tang et al., 2016), and markedly below the Food Standard of Australia and New Zealand (FSANZ) ML for Cd in leafy greens of 0.1 mg∙kg−1, and the Codex (2018) and European Commission (2006) MLs of 0.2 mg∙kg−1.
生菜平均Cd浓度与近期总膳食调查中的生菜浓度(0.4 mg∙kg−1 [DW](Pearson et al., 2018),或按5%干物质含量计为0.02 mg∙kg−1 [FW])以及Waikato地区商业销售的Iceberg生菜(平均值:0.019 mg∙kg−1;n = 11,范围0.004–0.042 mg∙kg−1)(Kim, 2005)相当,且低于Pukekohe商品菜园生菜的浓度(平均值:0.04 mg∙kg−1;n = 30,范围0.01–0.14 mg∙kg−1;(Roberts et al., 1995))。所有生菜类型的Cd浓度均处于国际研究报道范围(0.001–0.24 mg∙kg−1)的低端(Baldantoni et al., 2016; Grybauskait et al., 2014; Lin et al., 2015; Tang et al., 2016),且明显低于澳大利亚新西兰食品标准(FSANZ)规定的叶菜类Cd ML(0.1 mg∙kg−1),以及Codex(2018)和欧盟委员会(2006)规定的ML(0.2 mg∙kg−1)。
3.2. Onions – effect of cultivar3.2. 洋葱——品种效应
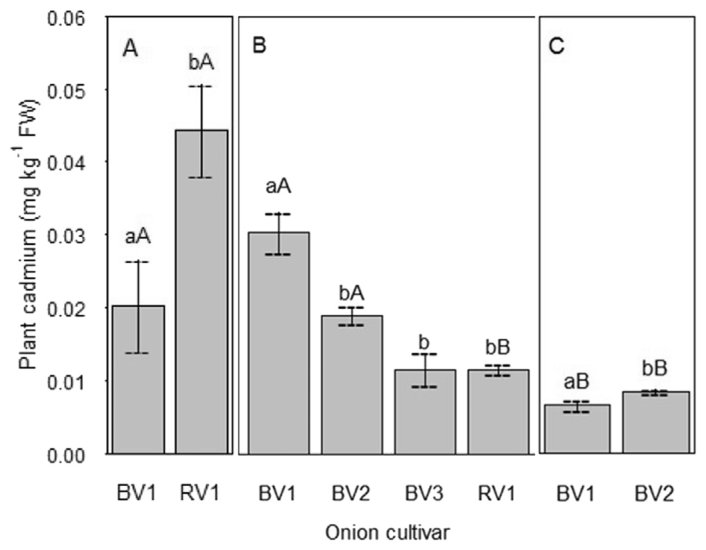
Mean onion Cd concentration in the four cultivars ranged between 0.008 mg∙kg−1 and 0.044 mg∙kg−1 (n = 32), with an overall mean concentration of 0.018 mg∙kg−1 (Fig. 2). This mean concentration is comparable to that in onions from a recent New Zealand total diet survey (0.2 mg∙kg−1 [DW] Pearson et al., 2018; 0.02 mg∙kg−1 [FW], assuming 10% dry matter), those sold commercially in the Waikato region (mean 0.016 mg∙kg−1, range 0.003–0.068 mg∙kg−1, n = 36; Kim, 2005), and Pukekohe (0.02 mg∙kg−1, range 0.01–0.11 mg∙kg−1, n = 30; Roberts et al., 1995). New Zealand onion concentrations were at the lower end of the range reported in international studies (0.003 to 0.41 mg∙kg−1) (Alexander et al., 2006; Bester et al., 2013; Bystricka et al., 2016; Grybauskait et al., 2014; Lin et al., 2015; Weeks et al., 2007), which were largely from residential gardens or pot trials. No ML is specified for bulb vegetables by FSANZ, although the mean concentration of Cd in the red onion from Pukekohe (RV1) was approaching the Codex and European MLs of 0.05 mg∙kg−1 (FW) (Codex, 2018; EC, 2006).
4个品种洋葱的平均Cd浓度介于0.008 mg∙kg−1~0.044 mg∙kg−1之间(n = 32),总平均浓度为0.018 mg∙kg−1(图2)。该平均浓度与新西兰近期总膳食调查中的洋葱浓度(0.2 mg∙kg−1 [DW] Pearson et al., 2018;按10%干物质含量计为0.02 mg∙kg−1 [FW])、Waikato地区商业销售的洋葱(平均值0.016 mg∙kg−1,范围0.003–0.068 mg∙kg−1,n = 36;Kim, 2005)以及Pukekohe的洋葱(0.02 mg∙kg−1,范围0.01–0.11 mg∙kg−1,n = 30;Roberts et al., 1995)相当。新西兰洋葱浓度处于国际研究报道范围(0.003~0.41 mg∙kg−1)的低端(Alexander et al., 2006; Bester et al., 2013; Bystricka et al., 2016; Grybauskait et al., 2014; Lin et al., 2015; Weeks et al., 2007),这些研究的样品主要来自住宅菜园或盆栽试验。FSANZ未规定鳞茎类蔬菜的ML,但Pukekohe红洋葱(RV1)的平均Cd浓度已接近Codex和欧盟的ML(0.05 mg∙kg−1(FW))(Codex, 2018; EC, 2006)。
There were significant differences in onion Cd concentrations between cultivars, although these were not consistent across sites (Fig. 2). Bystricka et al. (2016) found significant differences in onion Cd concentrations in six onion cultivars, with mean concentrations ranging between 0.022 and 0.04 mg∙kg−1 (FW), while Alexander et al. (2006) reported no difference in Cd uptake by six onion cultivars. The higher Cd concentration in the red onion from Pukekohe (RV1) may be attributable to the lower soil pH observed at this site compared to the other sites; soil carbon was also lower than most other sites (data not shown). Bester et al. (2013) found that higher pH and organic matter reduced onion Cd concentrations. A more extensive comparison between Cd uptake and soil properties for this study is reported in the next section.
不同品种间洋葱Cd浓度存在显著差异,但这些差异在各采样点间并不一致(图2)。Bystricka et al.(2016)发现6个洋葱品种的Cd浓度存在显著差异,平均浓度介于0.022~0.04 mg∙kg−1(FW)之间,而Alexander et al.(2006)报道6个洋葱品种的Cd吸收无差异。Pukekohe红洋葱(RV1)Cd浓度较高,可能归因于该采样点土壤pH低于其他采样点;其土壤碳含量也低于大多数其他采样点(数据未列出)。Bester et al.(2013)发现较高的pH和有机质可降低洋葱Cd浓度。本研究中Cd吸收与土壤性质之间更为全面的比较见下一节。
3.3. Field survey – soil properties3.3. 田间调查——土壤性质
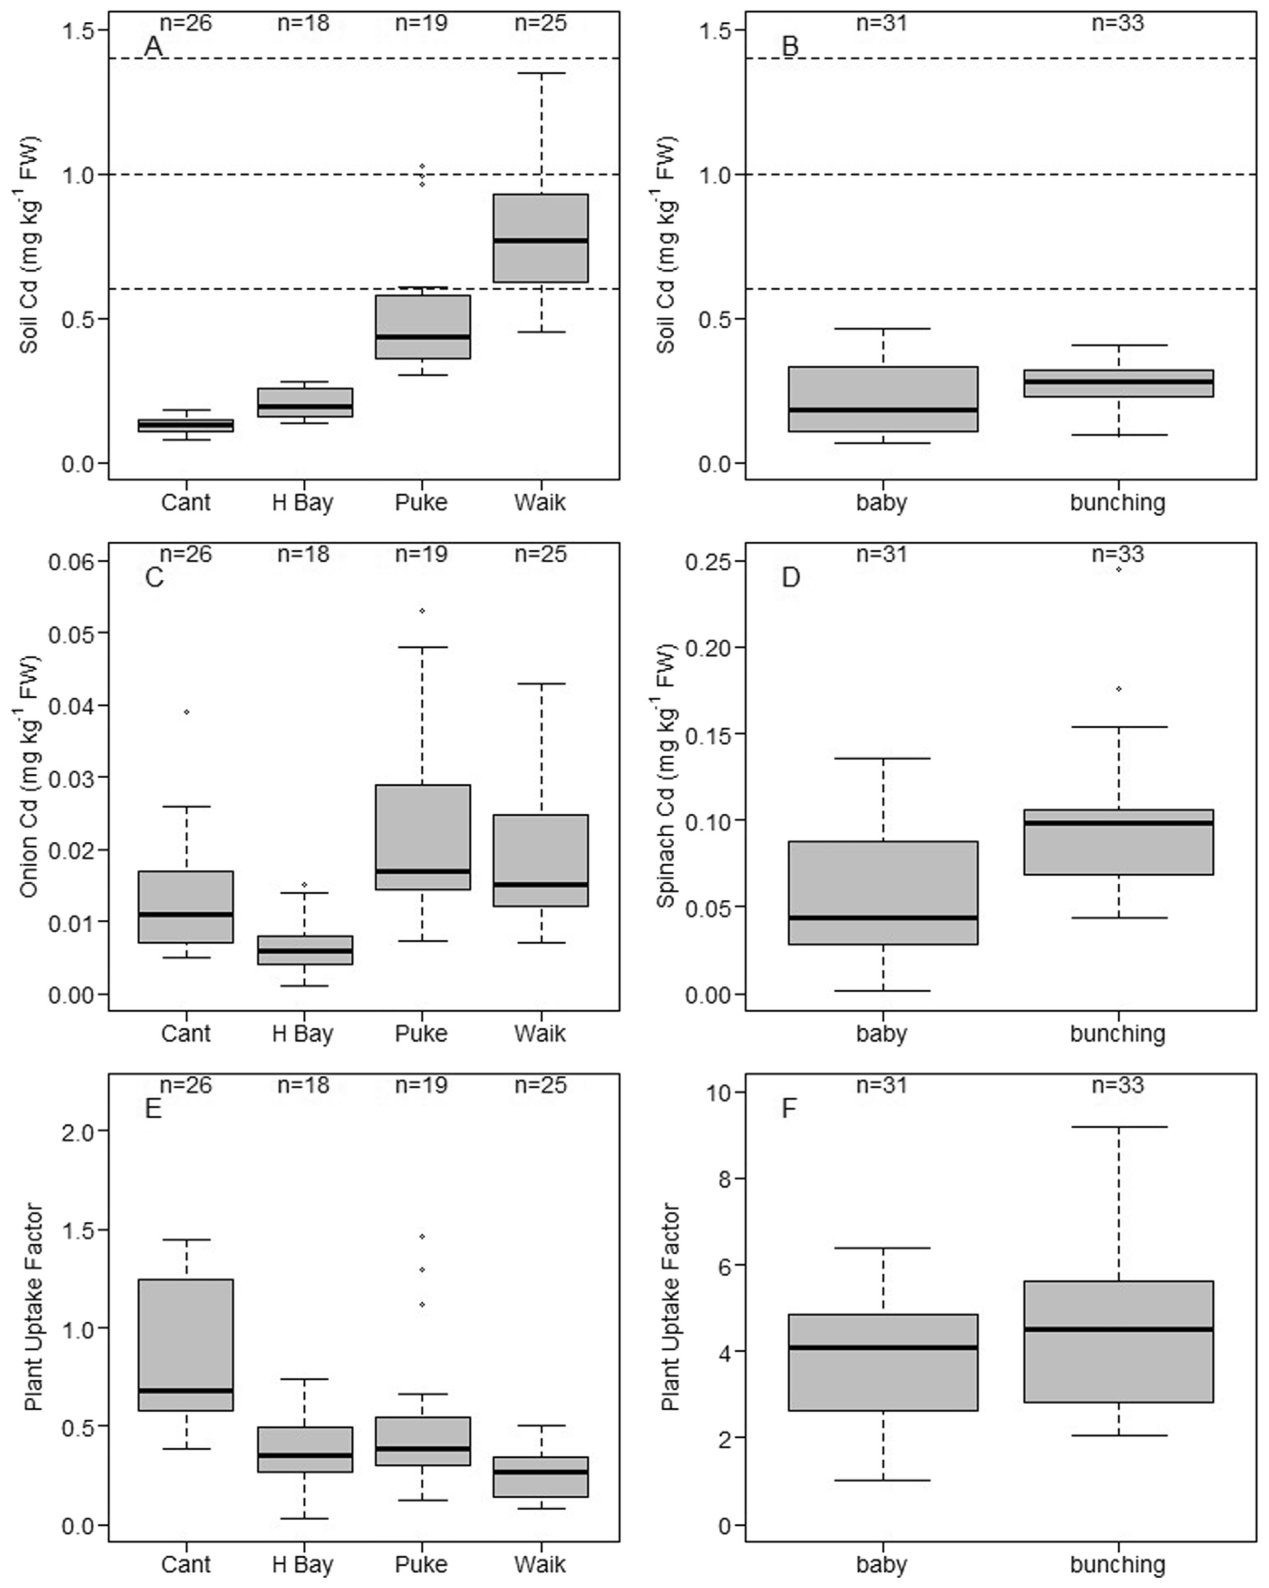
Mean concentrations of selected soil properties from the survey sites for onion and spinach are given in Table 2. Total soil Cd concentrations for the onion sites ranged between 0.08 and 1.35 mg∙kg−1. The overall mean soil Cd concentration for the onion sites was 0.42 mg∙kg−1 (median 0.29 mg∙kg−1), which is higher than the mean and median Cd for cropping soil of 0.28 mg∙kg−1 and 0.21 mg∙kg−1, respectively (Cavanagh, 2014). Cadmium concentrations in Waikato and Pukekohe are higher than those in Canterbury and Hawke's Bay (Fig. 3A), as observed in larger soil surveys (Cavanagh, 2014). The highest Cd concentrations in the Pukekohe region occurred in an organic soil, which had a low volume weight (surrogate for bulk density). Total soil Cd concentrations for the spinach sites ranged between 0.07 and 0.46 mg∙kg−1 (Fig. 3B), with mean soil concentration of 0.25 mg∙kg−1 (median 0.26 mg∙kg−1). Most onion samples (73%) and all spinach samples had soil Cd concentrations below the TFMS tier 1 trigger of 0.6 mg∙kg−1. Other soil properties recognised as affecting plant uptake of Cd also varied, with soil pH ranging from low to high, while total C and CEC were low to medium (Blakemore et al., 1987). Soil type ranged from clay to silt loams.
洋葱和菠菜调查采样点部分土壤性质的平均浓度见表2。洋葱采样点土壤总Cd浓度介于0.08~1.35 mg∙kg−1之间。洋葱采样点土壤Cd总平均浓度为0.42 mg∙kg−1(中位数0.29 mg∙kg−1),高于耕作土壤Cd的平均值0.28 mg∙kg−1和中位数0.21 mg∙kg−1(Cavanagh, 2014)。Waikato和Pukekohe的Cd浓度高于坎特伯雷和Hawke's Bay(图3A),这与更大规模土壤调查的结果一致(Cavanagh, 2014)。Pukekohe地区Cd浓度最高值出现在一种有机土中,该土壤容重(体积质量的替代指标)较低。菠菜采样点土壤总Cd浓度介于0.07~0.46 mg∙kg−1之间(图3B),平均土壤浓度为0.25 mg∙kg−1(中位数0.26 mg∙kg−1)。大多数洋葱样品(73%)和全部菠菜样品的土壤Cd浓度低于TFMS第1级触发值0.6 mg∙kg−1。公认影响植物Cd吸收的其他土壤性质也存在差异,土壤pH从低到高不等,而全碳和CEC处于低至中等水平(Blakemore et al., 1987)。土壤类型从黏土到粉砂壤土不等。
3.4. Field survey – cadmium concentrations in onions and spinach3.4. 田间调查——洋葱和菠菜中的镉浓度
Mean onion Cd concentration ranged between 0.007 and 0.05 mg∙kg−1 (n = 88), with an overall mean concentration of 0.016 mg∙kg−1 (Fig. 3C), similar to the cultivar study (Fig. 2). There was significant regional variation in onion Cd concentrations (Fig. 3C), with onions from Pukekohe, Waikato and Canterbury having significantly higher concentrations than those from Hawke's Bay (P b 0.05). Cadmium concentrations in onions from Pukekohe were significantly higher than those from Canterbury (P b 0.05), although there was no significant difference between Cd in onions from Canterbury and Waikato (P = 0.093). Plant uptake also varied between regions (Fig. 3E), and was highest in Canterbury and similar across the other regions. One site (three replicate plots) in Pukekohe showed elevated plant uptake; this site had an unusually low mean pH of 5.4 when compared to the other sites in the region (mean pH ranging between 6.0 and 6.6), which may explain the discrepancy.
洋葱平均Cd浓度介于0.007~0.05 mg∙kg−1之间(n = 88),总平均浓度为0.016 mg∙kg−1(图3C),与品种研究结果相似(图2)。洋葱Cd浓度存在显著的地区差异(图3C),Pukekohe、Waikato和坎特伯雷洋葱的浓度显著高于Hawke's Bay(P < 0.05)。Pukekohe洋葱的Cd浓度显著高于坎特伯雷(P < 0.05),而坎特伯雷与Waikato洋葱的Cd浓度无显著差异(P = 0.093)。植物吸收也存在地区差异(图3E),以坎特伯雷最高,其他地区相近。Pukekohe的1个采样点(3个重复小区)植物吸收偏高;与该地区其他采样点(平均pH介于6.0~6.6之间)相比,该采样点平均pH异常低(5.4),这可能解释了此差异。
Mean spinach Cd concentrations ranged between 0.005 and 0.11 mg∙kg−1 for baby leaf spinach (n = 31), with an overall mean of 0.06 mg∙kg−1 (Fig. 3D). Concentrations were generally higher in bunching spinach, and site mean concentrations ranged from 0.07 mg∙kg−1 to 0.19 mg∙kg−1, with an overall mean concentration of 0.1 mg∙kg−1 (n = 33). The overall mean for both spinach stages was 0.08 mg∙kg−1. Cadmium concentrations in spinach were at the lower end of the range (0.015 to 4.14 mg∙kg−1) reported in international studies (Grybauskait et al., 2014; Lin et al., 2015; Tack, 2017). The mean concentrations at a number of sites exceeded the FSANZ ML for Cd in leafy greens of 0.1 mg∙kg−1, although they were less than the Codex (2018) and European Commission MLs of 0.2 mg∙kg−1 (EC, 2006).
嫩叶菠菜的平均Cd浓度介于0.005~0.11 mg∙kg−1之间(n = 31),总平均值为0.06 mg∙kg−1(图3D)。成熟菠菜的浓度总体较高,采样点平均浓度介于0.07 mg∙kg−1~0.19 mg∙kg−1之间,总平均浓度为0.1 mg∙kg−1(n = 33)。两个菠菜生长阶段的总平均值为0.08 mg∙kg−1。菠菜中Cd浓度处于国际研究报道范围(0.015~4.14 mg∙kg−1)的低端(Grybauskait et al., 2014; Lin et al., 2015; Tack, 2017)。多个采样点的平均浓度超过了FSANZ规定的叶菜类Cd ML(0.1 mg∙kg−1),但低于Codex(2018)和欧盟委员会的ML(0.2 mg∙kg−1)(EC, 2006)。
The influence of harvest stage on Cd concentrations was assessed at two sites where baby leaf spinach, and subsequently bunching spinach from the same crop, was sampled. Bunching spinach had significantly higher concentrations than baby spinach, suggesting Cd continues to be accumulated over time and is not diluted with growth (Fig. A.3). Limited assessment of variation between cultivars was undertaken, with three cultivars tested at one site: two were grown at the same time, while a third was grown over winter and thus for a longer period. This cultivar had significantly elevated Cd compared to the other cultivars (Fig. A.3), which may be attributable to a longer growth period and/or cultivar variation.
在2个采样点评估了收获阶段对Cd浓度的影响,这些采样点先采集嫩叶菠菜,随后从同一作物采集成熟菠菜。成熟菠菜的浓度显著高于嫩叶菠菜,表明Cd随时间持续积累,而未因生长而被稀释(图A.3)。对品种间差异仅进行了有限的评估,在1个采样点测试了3个品种:其中2个同期种植,第3个在冬季种植,因而生长期更长。该品种的Cd显著高于其他品种(图A.3),这可能归因于较长的生长期和/或品种差异。
A second baby-leaf spinach crop (P1b2) grown at P1 had significantly higher Cd compared to the first baby spinach crop (P1b1), although the reason for this difference is unclear. Tack (2017) observed significantly higher concentrations in spinach subjected to limited water supply during periods of high demand, which may suggest water stress is a reason for the observed difference. However, further investigation, including of other crop management factors that have been shown to influence Cd uptake, such as fertiliser (N, micronutrients), is required (Jonsson and Asp, 2011, Paul and Chaney, 2017).
在P1种植的第二茬嫩叶菠菜(P1b2)Cd显著高于第一茬嫩叶菠菜(P1b1),但造成这一差异的原因尚不清楚。Tack(2017)观察到,在需水高峰期供水受限的菠菜中浓度显著较高,这提示水分胁迫可能是所观察到差异的原因之一。然而,仍需进一步研究,包括研究已证实会影响Cd吸收的其他作物管理因素,如施肥(N、微量营养元素)(Jonsson and Asp, 2011, Paul and Chaney, 2017)。
3.5. Relationship between soil properties and cadmium uptake by onions and spinach
3.5. 土壤性质与洋葱和菠菜镉吸收的关系
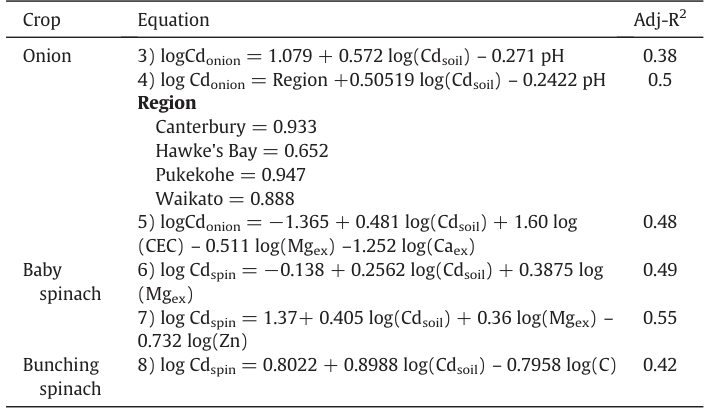
Soil Cd and pH were significant predictors of onion Cd concentrations, explaining 38% of the variation, while inclusion of region as an additional variable explained 50% of the variation (Table 3). Assessing the influence of a wider set of soil properties (and excluding region) also improved prediction, with soil Cd, CEC, and exchangeable Mg and Ca concentration explaining approximately 48% of the variability in onion Cd concentrations (Table 3), which may suggest it is differences in these variables that are leading to the observed influence of region.
土壤Cd和pH是洋葱Cd浓度的显著预测因子,可解释38%的变异,加入地区作为附加变量后可解释50%的变异(表3)。评估更广泛土壤性质的影响(不含地区)同样提高了预测能力,土壤Cd、CEC以及交换性Mg和Ca浓度可解释洋葱Cd浓度约48%的变异(表3),这可能表明正是这些变量的差异导致了所观察到的地区影响。
Clay content and chloride were not significant predictors of Cd concentration. The low proportion of variation explained may be attributable to the relatively small range in Cd concentration (0.08 to 1.35 mg∙kg−1) and other soil properties. For example, Bester et al. (2013) found pH, soil Cd and organic C explained 85% of the variation in onion Cd concentrations. However, in their study the range of soil Cd concentrations (0.2 to 40 mg∙kg−1) and organic matter (3.3% to 13.8%, or 1.9% C to 8% C), was much greater than in our study; moreover the Bester et al. (2013) study was undertaken over a much more limited geographical area, which we would expect to also constrain differences in plant uptake mainly to soil properties. Onion Cd concentrations predicted using the identified relationships (Eqs. (3) and (4) in Table 3) show that the models tend to under-predict onions with high Cd, compared with observed concentrations (Fig. A4).
黏粒含量和氯化物不是Cd浓度的显著预测因子。可解释变异比例较低,可能归因于Cd浓度(0.08~1.35 mg∙kg−1)及其他土壤性质的范围相对较小。例如,Bester et al.(2013)发现pH、土壤Cd和有机碳可解释洋葱Cd浓度85%的变异。然而,其研究中土壤Cd浓度(0.2~40 mg∙kg−1)和有机质(3.3%~13.8%,即1.9% C~8% C)的范围远大于本研究;此外,Bester et al.(2013)的研究所覆盖的地理范围要小得多,我们预计这也会使植物吸收的差异主要受土壤性质制约。利用所确定的关系(表3中式(3)和式(4))预测的洋葱Cd浓度表明,与实测浓度相比,模型往往低估高Cd洋葱的浓度(图A4)。
Soil Cd and exchangeable Mg were significant predictors of Cd concentration in baby spinach, explaining 49% of the variation in spinach
土壤Cd和交换性Mg是嫩叶菠菜Cd浓度的显著预测因子,可解释菠菜
Fig. 1. Cadmium concentration (mg∙kg−1) of different lettuce varieties grown in (A) Pukekohe, (B) Gisborne and (C) Canterbury. Mean and standard error (n = 3) indicated by the same lower case letter are not significantly different (P b 0.05) within a given region. Note: IB and IB2 grown in Pukekohe and Gisborne were grown at different locations from the other lettuce types. Mean and standard error (n = 3) indicated by the same uppercase letter are not significantly different (P b 0.05) between regions for the same lettuce type.图1. 在(A)Pukekohe、(B)Gisborne和(C)坎特伯雷种植的不同生菜品种的镉浓度(mg∙kg−1)。在同一地区内,标有相同小写字母的平均值和标准误(n = 3)无显著差异(P < 0.05)。注:在Pukekohe和Gisborne种植的IB和IB2与其他生菜类型种植于不同地点。对于同一生菜类型,标有相同大写字母的平均值和标准误(n = 3)在地区间无显著差异(P < 0.05)。
Summary of properties of sampled soils.
采样土壤性质汇总。
| Soil property土壤性质 | Lettuce soi生菜土壤 | ls | Onion soil洋葱土壤 | s | Spinach so菠菜土壤 | ils | |||
|---|---|---|---|---|---|---|---|---|---|
| Mean | Median | Range | Mean | Median | Range | Mean | Median | Range | |
| Total Cd (mg∙kg−1) | 0.3 | 0.16 | 0.10–0.78 | 0.42 | 0.29 | 0.08–1.35 | 0.25 | 0.27 | 0.07–0.47 |
| pH | 6.7 | 6.7 | 5.4–7.7 | 6.2 | 6.2 | 5.9–7.8 | 6.6 | 6.6 | 5.6–7.6 |
| Olsen P (mg∙kg−1) | 108 | 113 | 44–178 | 41 | 41 | 20–70 | 90 | 81 | 30–205 |
| Total P (mg∙kg−1) | 1530 | 1160 | 951–2690 | 1990 | 1660 | 694–4390 | 1645 | 1703 | 664–3376 |
| Total C (%) | 1.8 | 1.9 | 1.1–2.33 | 4.2 | 4.3 | 2.1–6.67 | 2.47 | 2.26 | 1.08–4.87 |
| Total N (%) | 1.3 | 1.01 | 0.55–2.55 | 0.39 | 0.42 | 0.17–0.64 | 0.24 | 0.23 | 0.08–0.51 |
| K (cmolc∙kg−1) | 14.9 | 11.1 | 7.6–27.4 | 0.86 | 0.79 | 0.29–1.56 | 1.1 | 0.9 | 0.3–3.22 |
| Ca (cmolc∙kg−1) | 2.3 | 1.6 | 0.78–3.89 | 9.91 | 9.6 | 7.4–12.8 | 12.8 | 11.9 | 5.1–22.9 |
| Mg (cmolc∙kg−1) | 0.3 | 0.23 | 0.1–0.63 | 1.53 | 1.36 | 0.63–2.85 | 1.8 | 1.49 | 0.64–6.45 |
| Na (cmolc∙kg−1) | 21.5 | 20 | 11–35 | 0.16 | 0.16 | 0.06–0.24 | 0.14 | 0.11 | 0.05–0.94 |
| CEC (cmolc∙kg−1) | 0.2 | 0.15 | 0.08–0.23 | 20 | 20 | 14–26 | 18 | 19 | 9–27 |
| Total Zn (mg∙kg−1) | 92 | 86 | 68–138 | 108 | 115 | 73–141 | 92 | 92 | 53–188 |
| Total Cl (mg∙kg−1)a | 22.3 | 21 | 9.1–50 | 28.5 | 30.2 | 17.7–36.1 | 13.5 | 10.1 | 2.0–47.6 |
| Sand (%)a | 12 | 12 | 3–27 | 17 | 14 | 2–35 | 18 | 11 | 0–43 |
| Silt (%)a | 44 | 47 | 28–61 | 52 | 50 | 43–63 | 49 | 49 | 25–71 |
| Clay (%)a | 43 | 50 | 12–60 | 27 | 28 | 23–29 | 31 | 29 | 12–66 |
a Total chloride and soil texture determined from a single composite transect taken across the site.
a 总氯化物和土壤质地由横跨采样点的单一混合样带测定。
Cd concentrations (Table 3). The inclusion of Zn increased the percentage of variation explained to 55%. While the influence of Zn on Cd uptake by plants is widely reported (e.g. Oliver et al., 1994; Sarwar et al., 2010), there are few studies that have examined the relationship between Cd and Mg, with studies generally reporting increased soil Mg concentrations lead to reduced Cd concentrations (Borisev et al., 2016; Kudo et al., 2015), whereas we observed the opposite. Further investigation is required to determine the significance of this finding. In bunching spinach, soil Cd and C were significant predictors of Cd concentrations, explaining 42% of the variation in spinach Cd concentrations (Table 3). Comparison of predicted Cd concentrations with observed concentrations showed no bias toward under- or over-prediction of either baby or bunching spinach Cd concentrations (Fig. A4).
Cd浓度49%的变异(表3)。加入Zn后,可解释变异的比例提高至55%。尽管Zn对植物Cd吸收的影响已被广泛报道(如Oliver et al., 1994; Sarwar et al., 2010),但研究Cd与Mg关系的研究很少,这些研究普遍报道土壤Mg浓度升高会导致Cd浓度降低(Borisev et al., 2016; Kudo et al., 2015),而本研究观察到的结果恰好相反。需进一步研究以确定这一发现的意义。在成熟菠菜中,土壤Cd和C是Cd浓度的显著预测因子,可解释菠菜Cd浓度42%的变异(表3)。预测Cd浓度与实测浓度的比较表明,无论嫩叶菠菜还是成熟菠菜的Cd浓度,均不存在低估或高估的偏差(图A4)。
The low to moderate proportion of the variation in plant Cd explained by the derived soil–plant relationships suggests that factors other than those assessed (e.g. water management, fertiliser input, climate) are also influencing plant uptake. The poor explanatory power is also partly attributable to the relatively narrow soil Cd concentration range, particularly for spinach, and other soil properties (e.g. pH) that are typically managed to meet agronomic optimums for individual crops. As sampling was undertaken in the main growing areas of each crop, soil Cd concentrations are considered to be representative of the concentrations in which these crops are currently grown, and further sampling within these regions is unlikely to extend the concentration range.
所建立的土壤–植物关系对植物Cd变异的解释比例低至中等,表明除所评估因素之外的其他因素(如水分管理、肥料投入、气候)也在影响植物吸收。解释能力较差的部分原因还在于土壤Cd浓度范围相对较窄(尤其是菠菜),以及其他土壤性质(如pH)通常被调控至各作物的农艺最佳水平。由于采样是在各作物的主要种植区进行的,土壤Cd浓度被认为代表了这些作物当前种植土壤的浓度水平,在这些地区进一步采样不太可能扩大浓度范围。
3.6. Implications for managing Cd uptake in leafy greens and onions to meet regulatory maximum levels
3.6. 对管理叶菜类和洋葱Cd吸收以符合法定最大限量的启示
Cadmium concentrations in all lettuce types assessed in this study were markedly below the FSANZ ML. The inclusion of regions where plant uptake of Cd was comparatively high, thereby posing greater risk of elevated plant Cd, suggests there is minimal risk of Cd concentrations in lettuce exceeding regulatory standards. Therefore the requirement for active management of Cd in lettuce crops is low. This is also reflected in the estimates of soil Cd concentrations above which food standards might be exceeded (nCdFS) for individual sites, which were markedly above current soil Cd concentrations measured in this study for the individual regions (Tables 4 & 5).
本研究评估的所有生菜类型的Cd浓度均明显低于FSANZ ML。纳入了植物Cd吸收相对较高、因而植物Cd升高风险更大的地区,这表明生菜Cd浓度超出法定标准的风险极小。因此,对生菜作物中Cd进行主动管理的需求较低。这也体现在对各采样点可能超出食品标准的土壤Cd浓度(nCdFS)的估算中,这些估算值明显高于本研究在各地区测得的现有土壤Cd浓度(表4和表5)。
A small number of onion samples had Cd concentrations close to or above the EC (2006) ML of 0.05 mg∙kg−1, and sites with elevated onion Cd concentrations often had a soil pH below 6. However, the nCdFS derived on the basis of the identified soil–plant relationships (Eqs. (3) and (4)), including at a pH of 5.5, were markedly above current soil Cd concentrations. This suggests caution in the use of these values, and relationships, as triggers for managing compliance with regulatory food standards. The nCdFS, derived from the PUF perhaps provides a better reflection of the Cd concentrations to indicate the risk of non-compliance and highlights the variability that can occur across individual sites.
少量洋葱样品的Cd浓度接近或超过EC(2006)规定的ML(0.05 mg∙kg−1),且洋葱Cd浓度偏高的采样点土壤pH往往低于6。然而,基于所确定的土壤–植物关系(式(3)和式(4))推导的nCdFS(包括pH为5.5时)明显高于现有土壤Cd浓度。这表明在将这些数值和关系用作管理法定食品标准合规性的触发值时需谨慎。由PUF推导的nCdFS或许能更好地反映指示不合规风险的Cd浓度,并凸显了各采样点之间可能存在的差异。
From a practical perspective, maintaining soil pH at or above 6 may be sufficient to ensure that Cd concentrations in the onion cultivar assessed in this study comply with relevant MLs. However, further testing of onions and soil, including additional cultivars, is required to determine the wider applicability of this observation. Similarly, further research could be undertaken to determine if plant management practices (such as irrigation, fertiliser type and rates, and amendment addition) affect Cd uptake, and could explain a greater proportion of the variation in onion Cd concentrations.
从实际角度看,将土壤pH维持在6或以上可能足以确保本研究所评估洋葱品种的Cd浓度符合相关ML。然而,仍需对洋葱和土壤(包括更多品种)进行进一步检测,以确定这一观察结果的更广泛适用性。同样,可进一步研究植物管理措施(如灌溉、肥料种类和用量以及添加改良剂)是否影响Cd吸收,以及能否解释洋葱Cd浓度中更大比例的变异。
The comparatively high Cd concentrations in baby and bunching spinach (close to or above the FSANZ ML of 0.1 mg∙kg−1 [FW]) suggest that management actions should be undertaken to reduce Cd uptake. The nCdFS derived using soil–plant relationships and PUF similarly identify that current soil Cd concentrations present a risk of non-compliance. As soil pH is typically managed to around 7 for spinach crops, adding lime offers limited value for reducing Cd uptake in spinach. Further, spinach from a number of sites with a pH close to 7 were close to or exceeded the ML.
嫩叶菠菜和成熟菠菜的Cd浓度相对较高(接近或超过FSANZ ML 0.1 mg∙kg−1 [FW]),表明应采取管理措施以降低Cd吸收。利用土壤–植物关系和PUF推导的nCdFS同样表明,现有土壤Cd浓度存在不合规风险。由于菠菜作物的土壤pH通常被调控在7左右,施用石灰对降低菠菜Cd吸收的作用有限。此外,多个pH接近7的采样点所产菠菜接近或超过了ML。
Given the significant relationship between Cd concentrations in bunching spinach and soil C, compost addition may help to reduce Cd uptake. However, field trials are required to establish the extent to which Cd concentration in bunching spinach is reduced. Some greenhouse trials have shown that adding municipal compost or manure to soil can reduce Cd uptake by spinach (Al Mamun et al., 2016; Kumarpandit et al., 2017), while others found that the reduction in pH following biosolids compost addition negated the Cd binding by the compost (Paul and Chaney, 2017). The latter study highlighted the importance of pH management, along with Zn supplementation, to minimise Cd uptake by spinach. Other management factors such as the watering regime (Tack, 2017), and nitrogenous fertilisers may also influence Cd uptake (e.g. Jonsson and Asp 2011). Further research on the influence of crop management practices, in particular water management but also N fertiliser and trace element application (e.g. Zn), on Cd uptake by spinach is required to determine the extent to which these practices can also be implemented to lower Cd uptake.
鉴于成熟菠菜Cd浓度与土壤C之间存在显著关系,添加堆肥可能有助于降低Cd吸收。然而,需要开展田间试验以确定成熟菠菜Cd浓度的降低程度。一些温室试验表明,向土壤中添加城市堆肥或粪肥可降低菠菜对Cd的吸收(Al Mamun et al., 2016; Kumarpandit et al., 2017),而另一些研究发现,添加生物固体(污泥)堆肥后pH降低,抵消了堆肥对Cd的结合作用(Paul and Chaney, 2017)。后一项研究强调了pH管理以及补充Zn对于尽量减少菠菜Cd吸收的重要性。其他管理因素,如灌水制度(Tack, 2017)和氮肥,也可能影响Cd吸收(如Jonsson and Asp 2011)。需要进一步研究作物管理措施,特别是水分管理,以及氮肥和微量元素(如Zn)施用对菠菜Cd吸收的影响,以确定这些措施在多大程度上也可用于降低Cd吸收。
Soil–plant transfer relationships derived for onion and spinach.
洋葱和菠菜的土壤–植物转移关系。
Finally, we note that the EU ML for spinach is double that of the FSANZ ML (0.2 mg∙kg−1 [FW] vs 0.1 mg∙kg−1 [FW]). As the standards are established on the basis of being as low as reasonably achievable while ensuring protection of human health, it may be relevant to review the FSANZ ML for spinach to determine whether this principle is being met.
最后,我们注意到欧盟对菠菜的ML是FSANZ ML的两倍(0.2 mg∙kg−1 [FW] vs 0.1 mg∙kg−1 [FW])。由于这些标准是在确保保护人体健康的前提下,依据“合理可行尽量低”的原则制定的,因此或许有必要对FSANZ的菠菜ML进行审查,以确定其是否符合该原则。
Soil Cd concentrations are often the primary focus for managing Cd uptake in food crops with soil–plant transfer models indicating key soil variables that influence Cd uptake and used to develop risk-based soil guideline values as a function of soil properties (e.g. de Vries and McLaughlin, 2013; Lu et al., 2017). Such values have successfully been used by farmers in the border area of the Netherlands and Belgium, resulting in trust between supermarkets, food companies, and regulators (Smolders et al., 2008). Our derived values are similar to those derived by Smolders et al., 2008 for onions and spinach, although are much higher for lettuce. However, the relatively low proportion of variation in plant Cd explained by our derived soil–plant relationships limits their application for this purpose. The wide range of nCdFS values derived using PUF highlights the variation that can exist between sites, and the challenge in applying generic Cd soil guideline values without considering other soil properties, even if developed for a specific crop and region. Equal weight should be placed on managing other soil properties, in particular pH and C, to ensure these are also at an optimum for minimising Cd uptake. Further, we suggest that crop management factors, in particular water management, may play a greater role in determining Cd uptake than previously thought, especially where relatively high plant Cd concentrations are observed in crops grown in soils with comparatively low soil Cd concentrations.
土壤Cd浓度通常是管理粮食作物Cd吸收的首要关注点,土壤–植物转移模型可指示影响Cd吸收的关键土壤变量,并用于制定随土壤性质变化的基于风险的土壤指导值(如de Vries and McLaughlin, 2013; Lu et al., 2017)。此类数值已被荷兰和比利时边境地区的农民成功应用,在超市、食品企业和监管机构之间建立了信任(Smolders et al., 2008)。本研究推导的洋葱和菠菜数值与Smolders et al., 2008的推导值相似,但生菜的数值要高得多。然而,本研究建立的土壤–植物关系对植物Cd变异的解释比例相对较低,限制了其在这方面的应用。利用PUF推导的nCdFS数值范围很宽,凸显了采样点之间可能存在的差异,以及在不考虑其他土壤性质的情况下应用通用土壤Cd指导值所面临的挑战,即使该指导值是针对特定作物和地区制定的。应同等重视对其他土壤性质(尤其是pH和C)的管理,以确保其也处于尽量减少Cd吸收的最佳水平。此外,我们认为作物管理因素,特别是水分管理,在决定Cd吸收方面可能发挥着比以往认为的更大的作用,尤其是在土壤Cd浓度相对较低的土壤中种植的作物却出现植物Cd浓度相对较高的情况下。
Soil cadmium concentrations at which EU maximum levels for onions (0.05 mg∙kg−1 FW) and FSANZ maximum levels for leafy greens (0.1 mg∙kg−1 FW) are predicted to be met (nCdFS), as a function of soil properties.
预测达到欧盟洋葱最大限量(0.05 mg∙kg−1 FW)和FSANZ叶菜类最大限量(0.1 mg∙kg−1 FW)时的土壤镉浓度(nCdFS)随土壤性质的变化。
| Onio洋葱 | ns | Spin菠菜 | ach | ||||
|---|---|---|---|---|---|---|---|
| Soil | nCdFS (mg | kg−1) | soil | nCdFS | |||
| pH | National average | Canterbury | Hawkes Bay | Pukekohe | Waikato | C | (mg kg−1) |
| 5.5 | 1.7 | 1.6 | 5.6 | 1.5 | 1.9 | 2 | 0.24 |
| 6 | 2 | 2.7 | 9.8 | 2.5 | 3.3 | 3.5 | 0.36 |
| 6.5 | 2.2 | 4.7 | 17.0 | 4.4 | 5.8 | 5 | 0.48 |
In addition to soil Cd concentrations, pH was a significant factor influencing Cd uptake in onions, and exchangeable Mg or C significantly influenced Cd concentrations in baby leaf and bunching spinach, respectively. The identification of pH and C as significant factors influencing Cd uptake in onion and bunching spinach, respectively, indicates management of these properties may help to minimise Cd uptake in those crops.
除土壤Cd浓度外,pH是影响洋葱Cd吸收的显著因素,而交换性Mg或C分别显著影响嫩叶菠菜和成熟菠菜的Cd浓度。pH和C分别被确定为影响洋葱和成熟菠菜Cd吸收的显著因素,表明对这些性质进行管理可能有助于尽量减少这些作物对Cd的吸收。
Soil–plant relationships identified for onions and spinach explained a low to moderate proportion of the variation, creating a low confidence in risk-based soil guideline values determined from these relationships. This is particularly the case for onions, for which the soil–plant relationship under-predicted elevated onion Cd concentrations. This low to moderate proportion of explained variation is partly attributable to the narrow range in some measured soil properties, but also suggests that factors other than those assessed are influencing plant uptake. More comprehensive research is required to determine the extent to which plant management practices such as water management or fertiliser type (especially micronutrients) and rates affect Cd uptake in these crops.
针对洋葱和菠菜确定的土壤–植物关系可解释低至中等比例的变异,导致由这些关系确定的基于风险的土壤指导值可信度较低。洋葱尤其如此,其土壤–植物关系低估了偏高的洋葱Cd浓度。可解释变异比例低至中等,部分归因于某些所测土壤性质的范围较窄,但也表明除所评估因素之外的其他因素也在影响植物吸收。需要开展更全面的研究,以确定水分管理或肥料种类(尤其是微量营养元素)和用量等植物管理措施在多大程度上影响这些作物的Cd吸收。
Acknowledgements致谢
Assistance from individual onion and leafy green growers to enable sampling to be undertaken is gratefully acknowledged. We thank two anonymous referees for their constructive comments that improved the manuscript.
衷心感谢各洋葱和叶菜种植者为采样工作提供的协助。感谢两位匿名审稿人提出的建设性意见,使本文得以完善。
Funding基金资助
This project was part of a larger project funded by the Ministry for Primary Industries and the Fertiliser Association of New Zealand, with support from Taranaki Regional Council, Manaaki Whenua − Landcare Research, Foundation for Arable Research, Waikato Regional Council, DairyNZ, Flour Millers Association, Bakers Industry Research Trust, Greater Wellington Regional Council, Ministry for the Environment, Beef + Lamb NZ, Bay of Plenty Regional Council, Vegetable New Zealand, OnionsNZ, Gisborne District Council, Environment Canterbury and Marlborough District Council.
本项目是由初级产业部(Ministry for Primary Industries)和新西兰肥料协会(Fertiliser Association of New Zealand)资助的一个更大项目的组成部分,并得到Taranaki Regional Council、Manaaki Whenua − Landcare Research、Foundation for Arable Research、Waikato Regional Council、DairyNZ、Flour Millers Association、Bakers Industry Research Trust、Greater Wellington Regional Council、Ministry for the Environment、Beef + Lamb NZ、Bay of Plenty Regional Council、Vegetable New Zealand、OnionsNZ、Gisborne District Council、Environment Canterbury和Marlborough District Council的支持。
Disclaimer免责声明
4Conclusions结论
Cadmium concentrations in a range of lettuce types and cultivars were more than tenfold lower than the FSANZ ML of 0.1 mg∙kg−1 (FW), with the lowest Cd concentrations consistently occurring in Iceberg lettuce. Cadmium concentrations in onions varied between sites, and mean concentrations (0.016 mg.kg−1 FW) were well below the Codex and EC MLs of 0.05 mg∙kg−1(FW). The highest Cd concentrations were observed in spinach, with concentrations in baby leaf and bunching spinach approaching or exceeding the FSANZ ML of 0.1 mg∙kg−1 (FW) at a number of sites, although they were below the Codex and EU MLs of 0.2 mg∙kg−1 (FW).
多种类型和品种莴苣中的Cd浓度比FSANZ最高限量(ML)0.1 mg∙kg−1(鲜重)低十倍以上,其中卷心莴苣(Iceberg)的Cd浓度始终最低。洋葱中的Cd浓度因地点而异,其平均浓度(0.016 mg.kg−1 鲜重)远低于Codex和EC规定的最高限量0.05 mg∙kg−1(鲜重)。菠菜中的Cd浓度最高,在若干地点,嫩叶菠菜和成束菠菜中的Cd浓度接近或超过FSANZ最高限量0.1 mg∙kg−1(鲜重),但仍低于Codex和EU规定的最高限量0.2 mg∙kg−1(鲜重)。
While every effort has been made to ensure the information is accurate, the funding parties do not accept any responsibility or liability for error of fact, omission, interpretation or opinion that may be present, nor for the consequences of any decisions based on this information. Any view or opinion expressed does not necessarily represent the views of the funding parties. The information in this publication is not government policy.
尽管已尽一切努力确保信息准确,但资助方对其中可能存在的事实错误、遗漏、解释或观点不承担任何责任或义务,亦不对基于本信息所作任何决策的后果承担责任。文中表达的任何看法或观点并不一定代表资助方的观点。本出版物中的信息不代表政府政策。
Competing interests利益冲突
The authors declare no competing interests.
作者声明不存在利益冲突。
Soil Cd concentrations (mean and 95th percentile range) at which EU maximum levels for onions (0.05 mg∙kg−1 FW) and FSANZ maximum levels for leafy greens (0.1 mg∙kg−1 FW) are predicted to be met (nCdFS), based on observed plant uptake in different regions.
基于不同地区观测到的植物吸收情况,预测可满足EU洋葱最高限量(0.05 mg∙kg−1 鲜重)和FSANZ绿叶蔬菜最高限量(0.1 mg∙kg−1 鲜重)的土壤Cd浓度(nCdFS)(平均值及第95百分位数范围)。
| Region地区 | nCdFS (mg kg−1)nCdFS (mg kg−1) | ||
|---|---|---|---|
| Onion | Lettuce | Spinach (all regionsa) | |
| Pukekohe | 1.43 | 5.6 | 0.35 baby leaf |
| (0.38–2.94) | (2.7–8.2) | (0.14–0.7) | |
| Waikato | 2.54 (1.05–5.0) | 0.29 bunching spinach | |
| Gisborne | 0.7 | 0.2–0.44) | |
| (0.45–1.1) | |||
| Hawke's Bay | 2.32 | ||
| (0.80–5.7) | |||
| Canterbury | 0.72 | 1.2 | |
| (0.35–1.24) | (0.65–1.9) |
a Regional estimates were not made as samples were from a limited number of sites within each region.
a 由于各地区样品仅来自有限数量的地点,故未进行区域估算。
Author contributions作者贡献
JC conceptualised the project, acquired the funding undertook the investigation data analysis and developed the original draft of the manuscript. ZY assisted with investigation under the supervision of NL, JC and BR. KM assisted with investigation, data curation and review of the manuscript. CG, NL, BR supported conceptualisation of the project and undertook review and editing of the manuscript.
JC构思了本项目,获取了资助,开展了调查和数据分析,并撰写了论文初稿。ZY在NL、JC和BR的指导下协助开展调查。KM协助开展调查、数据整理及论文审阅。CG、NL和BR参与了项目构思,并对论文进行了审阅和编辑。
Appendix A. Supplementary data附录A. 补充数据
Supplementary data to this article can be found online at https://doi. org/10.1016/j.scitotenv.2019.03.010.
本文补充数据可在线获取:https://doi. org/10.1016/j.scitotenv.2019.03.010。
EC (European Commission), 2006. Commission regulation (EC) no 1881/2006 of 19 December 2006 setting maximum levels for certain contaminants in foodstuffs. Off. J. Eur. Union 364 (49), 5–22.
EC (European Commission), 2006. Commission regulation (EC) no 1881/2006 of 19 December 2006 setting maximum levels for certain contaminants in foodstuffs. Off. J. Eur. Union 364 (49), 5–22.
EFSA, 2011. Statement on tolerable weekly intake for cadmium. EFSA J. 9 (2), 1975. https://doi.org/10.2903/j.efsa.2011.1975.
EFSA, 2011. Statement on tolerable weekly intake for cadmium. EFSA J. 9 (2), 1975. https://doi.org/10.2903/j.efsa.2011.1975.
EFSA, 2012. Cadmium dietary exposure in the European population. EFSA J. 10 (1), 2551. https://doi.org/10.2903/j.efsa.2012.2551.
EFSA, 2012. Cadmium dietary exposure in the European population. EFSA J. 10 (1), 2551. https://doi.org/10.2903/j.efsa.2012.2551.
Golia, E.E., Dimirkou, A., Mitsios, I.K., 2008. Influence of some soil parameters on heavy metals accumulation by vegetables grown in agricultural soils of different soil orders. Bull. Environ. Contam. Toxicol. 81, 8–84. Grant, C.A., Bailey, L.D., 1998. Nitrogen, phosphorus and zinc management effects on grain yield and cadmium concentration in two cultivars of durum wheat. Can. J. Plant Sci. 78, 63–70. Grant, C.A., Clarke, J.M., Duguid, S., et al., 2008. Selection and breeding of plant cultivars to minimize cadmium accumulation. Sci. Total Environ. 390, 301–310.
Golia, E.E., Dimirkou, A., Mitsios, I.K., 2008. Influence of some soil parameters on heavy metals accumulation by vegetables grown in agricultural soils of different soil orders. Bull. Environ. Contam. Toxicol. 81, 8–84. Grant, C.A., Bailey, L.D., 1998. Nitrogen, phosphorus and zinc management effects on grain yield and cadmium concentration in two cultivars of durum wheat. Can. J. Plant Sci. 78, 63–70. Grant, C.A., Clarke, J.M., Duguid, S., et al., 2008. Selection and breeding of plant cultivars to minimize cadmium accumulation. Sci. Total Environ. 390, 301–310.
Gray, C.W., McLaren, R.G., Roberts, A.H.C., 2001. Cadmium concentrations in some New Zealand wheat grain. N. Z. J. Crop. Hortic. Sci. 29, 125–136.
Gray, C.W., McLaren, R.G., Roberts, A.H.C., 2001. Cadmium concentrations in some New Zealand wheat grain. N. Z. J. Crop. Hortic. Sci. 29, 125–136.
Gray, C.W., Yi, Z., Lehto, N.J., et al., 2019a. Effect of cultivar and soil properties on cadmium uptake in potatoes. N. Z. J. Crop. Hortic. Sci. (accepted).
Gray, C.W., Yi, Z., Lehto, N.J., et al., 2019a. Effect of cultivar and soil properties on cadmium uptake in potatoes. N. Z. J. Crop. Hortic. Sci. (accepted).
References参考文献
Al Mamun, S., Chanson, G., Muliadiet, al, 2016. Municipal composts reduce the transfer of Cd from soil to vegetables. Environ. Pollut. 213, 8–15.
Alexander, P.D., Alloway, B.J., Dourado, A.M., 2006. Genotypic variations in the accumulation of Cd, Cu, Pb and Zn exhibited by six commonly grown vegetables. Environ. Pollut. 144, 736–745.
Baldantoni, D., Morra, L., Zaccardelli, M., et al., 2016. Cadmium accumulation in leaves of leafy vegetables. Ecotoxicol. Environ. Saf. 123, 89–94.
Bester, P.K., Lobnik, F., Erzen, I., et al., 2013. Prediction of cadmium concentration in selected home-produced vegetables. Ecotoxicol. Environ. Saf. 96, 182–190.
Blakemore, L., Searle, P.L., Daly, B.K., 1987. Methods for chemical analysis of soils. NZ Soil Bureau Scientific Report 80, 71–76.
Bolan, N.S., Duraisamy, V.P., 2003. Role of inorganic and organic soil amendments on immobilisation and phytoavailability of heavy metals: a review involving specific case studies. Aust. J. Soil Res. 41, 533–555.
Borisev, M., Pajevic, S., Nikolic, N., et al., 2016. Magnesium and iron deficiencies alter cd accumulation in Salix viminalis L. Int. J. Phytoremediation 18, 164–170.
Bystricka, J., Arvay, J., Musilova, J., et al., 2016. The investigation of sensitivity of different types of onion to heavy metal intake from contaminated soil. Int. J. Environ. Res. 10, 427–440.
Cavanagh, J., 2013. Methodologies for Deriving Cadmium Soil Guideline Values for the Protection of Ecological Receptors and Food Standards. Lincoln, New Zealand, Landcare Research.
Cavanagh, J., 2014. Status of Cadmium in New Zealand Soils. Lincoln, Landcare Research. Chaney, R.L., 2012. Food safety issues for mineral and organic fertilizers. Adv. Agron. 117, 51–116.
Cindric, I.J., Zeiner, M., Pozgaj, M., et al., 2015. Elemental characterisation of the medical plant Alchemilla velebitica. J. Trace Elem. Med. Biol. 31, 274–278.
Claydon, J.J., 1989. Determination of particle size distribution in fine-grained soil: Pipette method. Dept. of Scientific and Industrial Research. Lower Hutt, New Zealand. CODEX, 2018. General Standard for Contaminants and Toxins in Food and Feed. CXS 193- 1995. Codex Alimentarius Commission.
Crews, H.M., Davies, B.E., 1985. Heavy-metal uptake from contaminated soils by 6 varieties of lettuce (Lactuca-sativa l). J. Agric. Sci. 105, 591–595.
de Meeus, C., Eduljee, G.H., Hutton, M., 2002. Assessment and management of risks arising from exposure to cadmium in fertilisers. I. Sci. Total Environ. 291, 167–187.
de Vries, W., McLaughlin, M.J., 2013. Modeling the cadmium balance in Australian agricultural systems in view of potential impacts on food and water quality. Sci. Total Environ. 461, 240–257.
de Vries, W., Romkens, P.F.A.M., Schuetze, G., 2007. Critical soil concentrations of cadmium, lead, and mercury in view of health effects on humans and animals. Rev. Environ. Contam. Toxicol. 191, 91–130.
Gray, C.W., Yi, Z., Munir, K., et al., 2019b. Cadmium concentrations in New Zealand wheat – effect of cultivar type, soil properties and crop management. J. Environ. Qual. (accepted). Grybauskait, G., Laurinavicien, D., Cikockait, E., 2014. Cd and Pb concentrations in the main groups of foodstuff. Paper Presented at the 9th International Conference “Environmental Engineering”, 22–23 May 2014, Vilnius, Lithuania https://doi.org/10.3846/ enviro.2014.022. Guttieri, M.J., Baenziger, P.S., Frels, K., et al., 2015. Prospects for selecting wheat with increased zinc and decreased cadmium concentration in grain. Crop Sci. 55, 1712–1728. He, Q.B., Singh, B.R., 1994. Crop uptake of cadmium from phosphorus fertilizers.1. Yield and cadmium content. Water Air Soil Pollut. 74, 251–265.
Jonsson, E.H., Asp, H., 2011. Influence of nitrogen supply on cadmium accumulation in potato tubers. J. Plant Nutr. 34, 345–360.
Kim N 2005. Cadmium accumulation in Waikato soils. Environment Waikato Technical Report 2005/51. Hamilton, New Zealand, Environment Waikato.
Kudo, H., Kudo, K., Uemura, M., et al., 2015. Magnesium inhibits cadmium translocation from roots to shoots, rather than the uptake from roots, in barley. Botany 93, 345–351.
Kumarpandit, T., Kumarnaik, S., Patra, P.K., et al., 2017. Influence of organic manure and lime on cadmium mobility in soil and uptake by spinach (Spinacia oleracea L.). Commun. Soil Sci. Plant Anal. 48, 357–369. Li, C.C., Dang, F., Cang, L., et al., 2014. Integration of metal chemical forms and subcellular partitioning to understand metal toxicity in two lettuce (Lactuca sativa L.) cultivars. Plant Soil 384, 201–212. Lin, Y.W., Liu, T.S., Guo, H.Y., et al., 2015. Relationships between cd concentrations in different vegetables and those in arable soils, and food safety evaluation of vegetables in Taiwan. Soil Sci. Plant Nutr. 61, 983–998.
Lu, J.H., Yang, X.P., Meng, X.C., et al., 2017. Predicting cadmium safety thresholds in soils based on cadmium uptake by Chinese cabbage. Pedosphere 27, 475–481.
Lumley T 2017, Based on Fortran code by Alan Miller (2017). Leaps: regression subset selection. R Package Version 3.0. https://CRAN.R-project.org/package=leaps
MAF, 2011. Cadmium and New Zealand Agriculture and Horticulture: A Strategy for Long Term Risk Management. Wellington, Ministry of Agriculture and Forestry.
McBride, M., 2002. Cadmium uptake by crops estimated from soil total Cd and pH. Soil Sci. 167, 62–67.
MPI 2012. Working towards New Zealand risk-based soil guideline values for the management of cadmium accumulation on productive land. Landcare Research Report LC965 for the Ministry for Primary Industries. MPI Technical Paper No: 2012/06.
Oliver, D.P., Hannam, R., Tiller, K.G., et al., 1994. The effects of zinc fertilization on cadmium concentration in wheat-grain. J. Environ. Qual. 23, 705–711.
Olsen, S.R., 1954. Estimation of Available Phosphorus in Soils by Extraction with Sodium Bicarbonate. United States Department of Agriculture (Circular 939).
Paul, A.L.D., Chaney, R.L., 2017. Effect of Soil Amendments on Cd Accumulation by Spinach from a Cd-Mineralized Soil. J. Environ. Qual. 46, 707–713.
Pearson, A., Gibbs, M., Lau, K., et al., 2018. 2016 New Zealand Total Diet Survey. Wellington, New Zealand, Ministry for Primary Industries.
Plant and Food Research, 2017. Fresh facts. Plant and Food Research. Lincoln, New Zealand.
R Development Core Team, 2016. R: A Language and Environment for Statistical Computing. R Foundation for Statistical Computing, Vienna.
Rizwan, M., Ali, S., Adrees, M., et al., 2017. A critical review on effects, tolerance mechanisms and management of cadmium in vegetables. Chemosphere 182, 90–105.
Roberts, A.H.C., Longhurst, R.D., Brown, M.W., 1995. Cadmium survey of South Auckland market gardens and mid Canterbury wheat farms. Report. to the New Zealand Fertiliser Manufacturers Research Association.
Romkens, P., Guo, H.Y., Chu, C.L., Liu, T.S., Chiang, C.F., Koopmans, G.F., 2009. Prediction of Cadmium uptake by brown rice and derivation of soil-plant transfer models to improve soil protection guidelines. Environ. Pollut. 157, 2435–2444.
Romkens, P., Brus, D.J., Guo, H.Y., Chu, C.L., Chiang, C.M., Koopmans, G.F., 2011. Impact of model uncertainty on soil quality standards for cadmium in rice paddy fields. Sci. Total Environ. 409, 3098–3105.
Sarwar, N., Saifullah, Malhi, S.S., et al., 2010. Role of mineral nutrition in minimizing cadmium accumulation by plants. J. Sci. Food Agric. 90, 925–937.
Sghayar, S., Ferri, A., Lancilli, C., et al., 2015. Analysis of cadmium translocation, partitioning and tolerance in six barley (Hordeum vulgare L.) cultivars as a function of thiol metabolism. Biol. Fertil. Soils 51, 311–320.
Simmler, M., Ciadamidaro, L., Schulin, R., et al., 2013. Lignite reduces the solubility and plant uptake of cadmium in pasturelands. Environ. Sci. Technol. 47, 4497–4504.
Smolders, E., Jansson, G., Van Laer, L., et al., 2008. Teeltadvies voor de landbouw in kader van het Interreg project BeNeKempen. OVAM Public Waste Agency of Flanders https://www.ovam.be/sites/default/files/ovor080623_Benekempen_landbouw_ teeltadvies.pdf (Dutch).
Swartjes, F.A., 2007. Insight into the variation in calculated human exposure to soil contaminants using seven different European models. Integr. Environ. Assess. Manag. 3, 322–332.
Tack, F.M.G., 2017. Watering regime influences cd concentrations in cultivated spinach. J. Environ. Manag. 186, 201–206.
Tang, X.W., Pang, Y., Ji, P.H., et al., 2016. Cadmium uptake in above-ground parts of lettuce (Lactuca sativa L.). Ecotoxicol. Environ. Saf. 125, 102–106.
Toth, G., Hermann, T., Da Silva, M.R., et al., 2016. Heavy metals in agricultural soils of the European Union with implications for food safety. Environ. Int. 88, 299–309.
Venables, W.N., Ripley, B.D., 2002. Modern Applied Statistics with S. 4th edition. Springer, New York, NY.
Weeks, C.A., Brown, S.N., Vazquez, I., et al., 2007. Multi-element survey of allotment produce and soil in the UK. Food Addit. Contam. 24, 877–885.
Yang, Y., Chen, W.P., Wang, M.E., et al., 2016. Regional accumulation characteristics of cadmium in vegetables: influencing factors, transfer model and indication of soil threshold content. Environ. Pollut. 219, 1036–1043.
Zhang, K., Yuan, J.G., Kong, W., et al., 2013. Genotype variations in cadmium and lead accumulations of leafy lettuce (Lactuca sativa L.) and screening for pollution-safe cultivars for food safety. Environ. Sci.: Processes Impacts 15, 1245–1255.