Article
María Jesús Gutiérrez-Ginés 1,* , Brett H. Robinson 2 , Sky Halford 1, Izzie Alderton 1 , Vikki Ambrose 1, Jacqui Horswell 1 and Hamish Lowe 3
1 Institute of Environmental Science and Research (ESR), Christchurch 8041, New Zealand
1 环境科学与研究所(Institute of Environmental Science and Research, ESR),新西兰基督城 8041
2 School of Physical and Chemical Sciences, University of Canterbury, Christchurch 8041, New Zealand; brett.robinson@canterbury.ac.nz
3 Lowe Environmental Impact, Palmerston North 4410, New Zealand; hamish@lei.co.nz
* Correspondence: maria.gutierrez-gines@esr.cri.nz
Academic Editor: Jia Wen
Received: 25 September 2023 Revised: 10 November 2023 Accepted: 13 November 2023 Published: 23 November 2023
Copyright: © 2023 by the authors. Licensee MDPI, Basel, Switzerland. This article is an open access article distributed under the terms and conditions of the Creative Commons Attribution (CC BY) license (https:// creativecommons.org/licenses/by/ 4.0/).
版权:© 2023 作者所有。授权方 MDPI,瑞士巴塞尔。本文为开放获取文章,依据知识共享署名(CC BY)许可协议(https:// creativecommons.org/licenses/by/ 4.0/)条款发布。
Abstract: The benefits and risks of irrigation with treated municipal wastewater (TMW) on soil quality and crop production have been largely investigated. However, there is a lack of knowledge on the effect of plant species on the interaction between soil quality and TMW. We leveraged a natural experiment investigating the effect of 30 years of TMW irrigation at a rate of 4 m y−1 (eq. 1860 kg N ha−1 y−1, and 264 kg P ha−1 y−1) on a sandy soil under pine plantation and pasture, compared with soil under New Zealand native Kunzea robusta. There was a consistent increase in soil P with irrigation under both pasture (Olsen P in topsoil 40 mg kg−1 vs. 74 mg kg−1) and pine (18 mg kg−1 vs. 87 mg kg−1), which was significant down to 2 m deep. The pH, electrical conductivity, total organic C and N, inorganic N and Na were affected by both irrigation and vegetation type. Beyond P soil accumulation, there was no evidence of soil degradation by Na or trace element accumulation. Estimations of nutrient mass balance indicated that 80% and 60% of the total applied P was lost under pine and pasture, respectively. This percentage increased to 96% and 83% for N, respectively. Although plant species had a significant effect on soil quality and N and P losses from TMW-irrigated areas, adjusting irrigation rates to levels that can be managed by plants is the only way to design sustainable TMW irrigation schemes.
摘要:利用处理后的城市污水(TMW)进行灌溉对土壤质量和作物生产的益处与风险已得到广泛研究,但关于植物种类对土壤质量与TMW之间相互作用影响的认识仍较缺乏。本研究借助一项自然实验,考察了以4 m y−1的速率(相当于1860 kg N ha−1 y−1和264 kg P ha−1 y−1)持续30年的TMW灌溉对松树人工林和牧场下砂质土壤的影响,并与新西兰本土植物Kunzea robusta下的土壤进行比较。在牧场(表土Olsen P为40 mg kg−1对74 mg kg−1)和松树(18 mg kg−1对87 mg kg−1)下,灌溉均使土壤P一致增加,且直至2 m深度仍具显著性。pH、电导率、总有机C和N、无机N及Na均同时受到灌溉和植被类型的影响。除土壤P累积外,未发现Na或微量元素累积导致土壤退化的证据。养分质量平衡估算表明,松树和牧场下分别有80%和60%的施入总P发生损失;N的相应比例分别升至96%和83%。尽管植物种类对TMW灌溉区的土壤质量及N、P损失具有显著影响,但将灌溉速率调整至植物可消纳的水平,是设计可持续TMW灌溉方案的唯一途径。
Keywords: treated effluent; carbon stocks; phosphorus; nitrogen; sodium; pine; pasture; k¯anuka
关键词:处理后出水;碳储量;磷;氮;钠;松树;牧场;卡努卡
1Introduction引言
Three-quarters of the wastewater produced in developed countries is treated before it is discharged into the environment [1]. Depending on the treatment process, treated municipal wastewater (TMW) contains elevated concentrations of organic matter, macroand micronutrients, and contaminants, which can cause water pollution and eutrophication in receiving environments [2–4]. Applying TMW to land can provide an extra level of protection to ground and surface waters because the plants and other organisms in terrestrial ecosystems can metabolise some of the macro- and micronutrients added to the TMW [5]. They can also degrade or attenuate, to a certain extent, some other contaminants [6,7].
发达国家产生的污水中有四分之三在排入环境前经过处理[1]。根据处理工艺的不同,处理后的城市污水(TMW)含有较高浓度的有机质、大量和微量营养元素以及污染物,可能导致受纳环境的水体污染和富营养化[2–4]。将TMW施用于土地可为地下水和地表水提供额外的保护,因为陆地生态系统中的植物及其他生物能够代谢TMW中的部分大量和微量营养元素[5]。它们还能在一定程度上降解或削减其他一些污染物[6,7]。
In countries with a water deficit, TMW is an important alternative water source that can alleviate or substitute the extraction of freshwater resources [6]. Research worldwide has demonstrated the benefits of TMW irrigation as an alternative water source, with the extra opportunity to recover plant nutrients to grow a wide range of plants, such as crops, fruit trees, timber trees, or recreational areas such as golf courses or urban parks [5,8–16]. No differences in plant health and growth [5,15,16] or increased crop yield with TMW irrigation compared with freshwater irrigation or no irrigation were found [5,10,11,13,16]. Although there are no records of the deleterious effect of TMW irrigation on plant growth, there are risks associated with the reuse of TMW. Pedrero and colleagues [5] demonstrated the potential for the plant uptake of trace elements after TMW irrigation; however, the concentrations were not considered to be concerning for human health. Asgari and Cornelis [17] found no significant accumulation of trace elements in soil irrigated with TMW compared with freshwater irrigation; however, Cd, Cr, and Ni were taken up by crops at concentrations that exceeded guideline values.
在缺水国家,TMW是一种重要的替代水源,可缓解或替代对淡水资源的开采[6]。世界各地的研究已证明TMW作为替代水源用于灌溉的益处,并且还可回收植物养分,用于种植多种植物,如作物、果树、用材树种,或用于高尔夫球场、城市公园等休闲区域[5,8–16]。与淡水灌溉或不灌溉相比,TMW灌溉下植物健康和生长无差异[5,15,16],或作物产量有所提高[5,10,11,13,16]。尽管尚无TMW灌溉对植物生长产生有害影响的记录,但TMW回用仍存在相关风险。Pedrero及其同事[5]证明了TMW灌溉后植物吸收微量元素的可能性,但其浓度被认为不足以对人体健康构成威胁。Asgari和Cornelis[17]发现,与淡水灌溉相比,TMW灌溉土壤中微量元素无显著累积,但作物对Cd、Cr和Ni的吸收浓度超过了指导限值。
Changes in soil quality due to repeated TMW irrigation may be more detrimental than the impacts of TMW on plant health due to the long-term consequences of soil degradation. Results have consistently shown a general increase in P, Na, electrical conductivity (EC), and trace elements after long-term TMW irrigation compared with soils that received freshwater irrigation [14,18–21]. An increase in salinity (EC) and sodicity (Na, SAR—sodium adsorption ratio, and ESP—exchangeable sodium percentage) of TMW-irrigated soils can reduce soil fertility and soil permeability through Na-induced clay dispersion [19,22]. The results of other soil parameters, such as pH, texture, total N (TN), or total organic C (TOC), are less consistent between experiments. Angin and colleagues [18], for example, demonstrated a significant decrease in soil pH after 30 years of TMW irrigation of sandy alluvial soils, while Bedbabis and co-authors [10] reported an increase in soil pH of a sandy-silt soil irrigated for 10 years. Qian and Mecham [14] reported no differences in soil organic carbon (SOC) in five golf courses irrigated with TMW for 5–30 years compared with the other five that were irrigated just with freshwater. However, Khajanchi-Lal and colleagues [21] demonstrated an increase in TOC in different crop soils irrigated with TMW compared with groundwater. The differences in the time periods of irrigation, soil types, and vegetation make it difficult to draw conclusions.
由于土壤退化具有长期后果,反复TMW灌溉引起的土壤质量变化可能比TMW对植物健康的影响危害更大。研究结果一致表明,与接受淡水灌溉的土壤相比,长期TMW灌溉后土壤P、Na、电导率(EC)和微量元素普遍增加[14,18–21]。TMW灌溉土壤盐度(EC)和钠质化程度(Na、SAR——钠吸附比,以及ESP——交换性钠百分率)的升高,可通过Na诱导的黏粒分散降低土壤肥力和渗透性[19,22]。其他土壤参数,如pH、质地、全氮(TN)或总有机碳(TOC),在不同试验间的结果则不太一致。例如,Angin及其同事[18]证明,砂质冲积土经30年TMW灌溉后土壤pH显著降低,而Bedbabis及其合作者[10]报道,经10年灌溉的砂质粉土土壤pH升高。Qian和Mecham[14]报道,5个经TMW灌溉5–30年的高尔夫球场与另外5个仅用淡水灌溉的高尔夫球场相比,土壤有机碳(SOC)无差异。然而,Khajanchi-Lal及其同事[21]证明,与地下水灌溉相比,TMW灌溉下不同作物土壤的TOC增加。灌溉时长、土壤类型和植被的差异使得难以得出结论。
Beyond TMW, the type of vegetation irrigated can also significantly change the effects that TMW has on the soil. Plants can affect nutrient cycling in the soil in different ways, for example, through biological nitrification inhibition [23,24]. In an experiment where TMW was applied to different plant species, Meister and co-authors [25] demonstrated that some soil chemical properties (SOC, TN, Mg, and Na) were as affected by four-year TMW irrigation as they were by the type of vegetation. They also demonstrated that the effect of irrigation on some soil parameters (such as NH4+, Na, Cr, and Li) was different depending on the type of vegetation present.
除TMW本身外,所灌溉的植被类型也会显著改变TMW对土壤的影响。植物可通过不同方式影响土壤养分循环,例如生物硝化抑制作用[23,24]。在一项对不同植物种类施用TMW的试验中,Meister及其合作者[25]证明,部分土壤化学性质(SOC、TN、Mg和Na)受4年TMW灌溉的影响程度与受植被类型的影响程度相当。他们还证明,灌溉对某些土壤参数(如NH4+、Na、Cr和Li)的影响因所存在的植被类型而异。
Understanding the relationships between soil, vegetation, and TMW is important for well-designed TMW irrigation systems that are sustainable in the long term, rather than the normal irrigation design based solely on TMW quality and soil properties. This work presents soil chemistry results of a natural experiment [26] of a TMW irrigation site planted with Pinus radiata and pasture irrigated for 30 years, with some areas that did not receive any irrigation during that period but were managed similarly. We aimed to quantify the changes in soil properties in a soil profile after a long-term TMW irrigation and determine how vegetation types can modify those changes, including a soil under native vegetation that did not receive irrigation for comparison. Further, we sought to estimate a mass balance of nutrients in the soil–plant systems.
与通常仅基于TMW水质和土壤性质的灌溉设计相比,理解土壤、植被与TMW之间的关系,对于设计长期可持续的TMW灌溉系统十分重要。本文报道了一项自然实验[26]的土壤化学结果:该TMW灌溉场地种植了Pinus radiata和牧草,已灌溉30年,其中部分区域在此期间未接受任何灌溉但管理方式相似。本研究旨在量化长期TMW灌溉后土壤剖面中土壤性质的变化,并确定植被类型如何改变这些变化,同时以未经灌溉的本土植被下土壤作为对照。此外,我们还尝试估算土壤–植物系统中养分的质量平衡。
2Materials and Methods材料与方法
2.1. Study Site and Soil Collection2.1. 研究地点与土壤采集
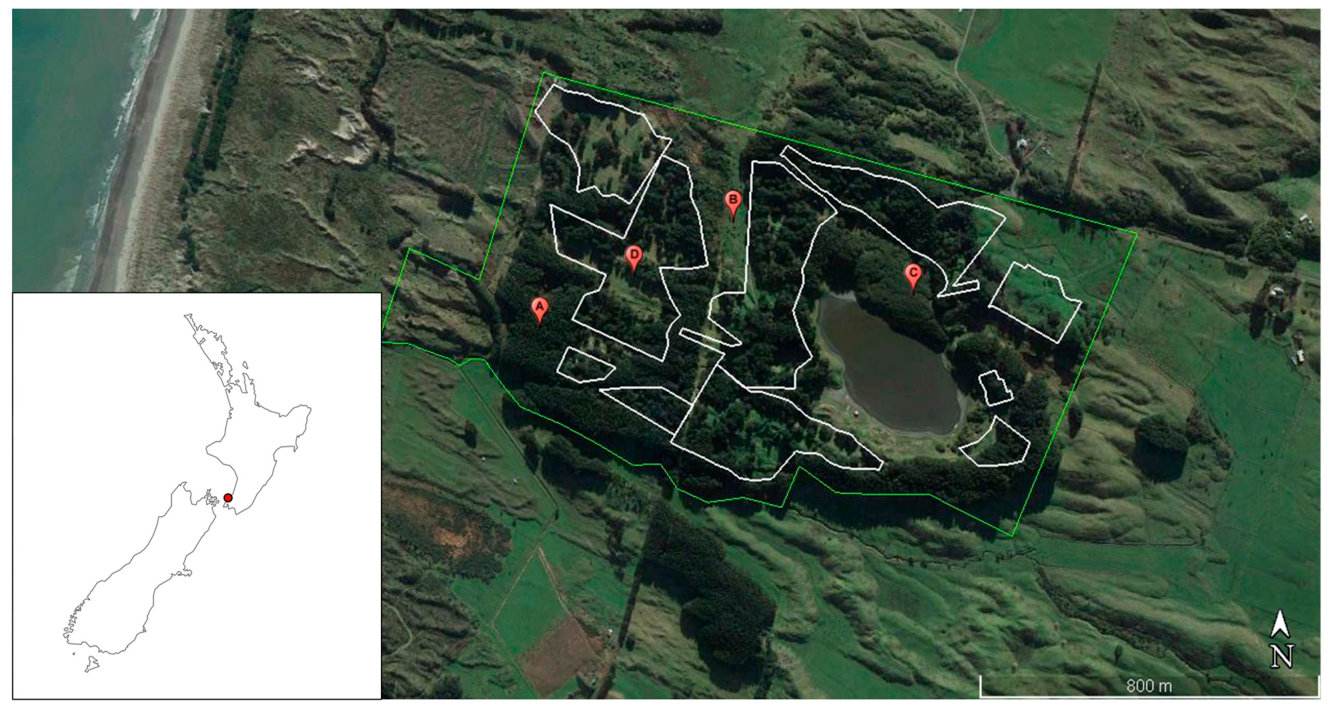
Since 1987, TMW from a wastewater treatment plant that serves a population of 19,000 people in New Zealand (NZ) (40◦37′07′′ S, 175◦15′37′′ E) has been pumped 7 km to a 7 ha effluent infiltration pond (40◦37′47′′ S, 175◦11′22′′ E), with the remaining volume sprayed over 40.5 ha of Pinus radiata D. Don plantation and grazed pasture (mostly Lolium perenne L.) (Figure 1). Located 2 km from the sea, the total area of operation was 110 ha, and the underlying soil is classified as Sandy Recent [27].
自1987年以来,新西兰(NZ)一座服务人口19,000人的污水处理厂(40◦37′07′′ S, 175◦15′37′′ E)的TMW经7 km管道泵送至一个7 ha的出水渗滤池(40◦37′47′′ S, 175◦11′22′′ E),其余水量则喷洒于40.5 ha的Pinus radiata D. Don人工林和放牧草地(主要为Lolium perenne L.)上(图1)。该区域距海2 km,运行总面积为110 ha,下伏土壤被分类为砂质新成土(Sandy Recent)[27]。
The irrigation system has been applying between 75 and 100 mm of TWW once per week to the 40.5 ha area, with an approximate annual irrigation rate of 4000 mm y−1, ranging between 3700 mm y−1 and 4400 mm y−1 depending on seasons, years, and areas of the irrigated land. Since 2016, the wastewater has been regularly monitored in different irrigation pumps and in the pond for the parameters shown in Table 1. The non-irrigated area also contained sections with radiata pine and pasture, as well as remnants of indigenous vegetation, comprised mostly of k¯anuka (Kunzea robusta de Lange & Toelken) (Figure 1).
该灌溉系统每周一次向40.5 ha区域施用75至100 mm的TWW,年灌溉量约为4000 mm y−1,依季节、年份及灌溉地块不同在3700 mm y−1至4400 mm y−1之间变化。自2016年以来,定期在不同灌溉泵和渗滤池中对污水进行表1所列参数的监测。未灌溉区域同样包含辐射松和牧场地块,以及残存的原生植被,主要为卡努卡(Kunzea robusta de Lange & Toelken)(图1)。
Ten locations were selected randomly from each plant cover type (pine, pasture, and kanuka) and irrigated and non-irrigated areas (Figure¯ 1). In each location, the soil profile was sampled at different depths (0–7.5 cm, 7.5–15 cm, 15–30 cm, 30–45 cm, 45–60 cm, 60–80 cm) using a soil corer. At each sampling point, three to five cores in an area not bigger than 1 m2 were dug to obtain a sufficient sample for chemical analysis. An additional three soil cores per plant type and irrigation were dug with a soil auger to reach the water table, with samples collected at 100 cm, 200 cm, and/or at the water table. The 339 soil samples were transported in chilly bins to the laboratory, passed through a 4 mm stainless steel sieve, and stored at −20 ◦C until analysis of inorganic N. For the rest of the analyses, the soil samples were dried at room temperature for 15 days, and a subsample was dried at 104 ◦C for one week to calculate soil moisture.
在每种植被覆盖类型(松树、牧场和卡努卡)的灌溉区和未灌溉区各随机选取10个样点(图1)。在每个样点,使用土钻在不同深度(0–7.5 cm、7.5–15 cm、15–30 cm、30–45 cm、45–60 cm、60–80 cm)采集土壤剖面样品。在每个采样点,于面积不超过1 m2的范围内钻取3–5个土芯,以获得足够的化学分析样品。此外,每种植物类型和灌溉处理另用土钻钻取3个土芯直至地下水位,在100 cm、200 cm和/或地下水位处采样。339个土壤样品装入冷藏箱运回实验室,过4 mm不锈钢筛,并在−20 ◦C下保存直至测定无机N。其余分析所用土壤样品于室温下风干15天,另取一份子样在104 ◦C下烘干一周以计算土壤含水量。
2.2. Chemical Analysis2.2. 化学分析
All samples collected were analysed for inorganic N, pH, and EC. NO3−-N and NH4+- N were determined in 2 M KCl soil extracts [28] using an FIA—Flow Injection Analyser (QuikChem 8500, Lachat Instruments, Milwaukee, WI, USA). The pH and electrical conductivity (EC) were analysed in a 1:5 soil/water extraction with a pH and conductivity meter, respectively (Con700 and pH700, respectively, Eutech Instruments, Singapore). The following analyses were performed in 5–10 replicates per selected area and at every second soil depth (see Supplementary Material). Total N (TN) and total organic C (TOC) were determined using an Vario-Max CN Elementar Analyser (Elementar®, Langenselbold, Germany). The Olsen-extractable P was extracted with 0.5 M NaHCO3 [28], and the extracts were analysed with a SmartChem 200 Discrete Analyzer (AMS/Alliance Instruments, Frépillon, France). Total P (TP) was extracted by the Ignite P method described in [28] and analysed with QuikChem 8500 FIA. Phosphate retention was analysed only in pasture and pine areas, irrigated and non-irrigated. This was calculated as the decrease in P in a 1000 mg L−1 P solution at pH 4.6 after shaking for 16 h [29]. After that period, the remaining P in the solution was analysed by FIA. Total elements were microwave acid extracted (MARSXpress, CEM, Matthews, NC, USA) according to the equipment specifications (0.5 g soil, 4.0 mL 69% trace element grade HNO3, and 4.0 mL 30% H2O2) and analysed using an inductively coupled plasma optical emission spectrometry (ICP-OES Varian 720ES, ICP-OES (Varian 720-ES, Varian Inc., Walnut Creek, CA, USA). The results were corrected for samples oven-dried at 104 ◦C for one week.
所有样品均测定无机N、pH和EC。采用2 M KCl浸提土壤[28],用流动注射分析仪(FIA,QuikChem 8500,Lachat Instruments,Milwaukee,WI,USA)测定NO3−-N和NH4+-N。pH和电导率(EC)以1:5土水比浸提,分别用pH计和电导率仪测定(分别为Con700和pH700,Eutech Instruments,Singapore)。以下分析在每个选定区域进行5–10次重复,并隔层测定(见补充材料)。全氮(TN)和总有机碳(TOC)采用Vario-Max CN元素分析仪(Elementar®,Langenselbold,Germany)测定。Olsen有效P用0.5 M NaHCO3浸提[28],浸提液用SmartChem 200间断化学分析仪(AMS/Alliance Instruments,Frépillon,France)测定。全磷(TP)采用[28]所述的灼烧法(Ignite P)提取,并用QuikChem 8500 FIA测定。磷吸持仅在灌溉与未灌溉的牧场和松树区域测定,计算方法为:在pH 4.6的1000 mg L−1 P溶液中振荡16 h后P的减少量[29]。之后,用FIA测定溶液中剩余的P。全量元素按照仪器说明采用微波酸消解提取(MARSXpress,CEM,Matthews,NC,USA)(0.5 g土壤,4.0 mL 69%痕量级HNO3和4.0 mL 30% H2O2),并用电感耦合等离子体发射光谱仪(ICP-OES Varian 720-ES,Varian Inc.,Walnut Creek,CA,USA)测定。结果以在104 ◦C下烘干一周的样品为基准进行校正。
2.3. Data Analysis2.3. 数据分析
Soil C, N, P, and Na stocks were calculated. Given the raw sand nature of the soil, we assumed that sample density was equivalent to soil density. We determined sample density by weighing a known volume of dry sample in 16 samples selected randomly from different locations, treatments, and soil depths from the 339 collected. Sample density was calculated for the remaining samples as a function of TOC (p < 0.0001, R2 = 0.91, see Supplementary Material). The element concentration of each sample was used to calculate the total mass of the selected element at that soil depth. For the soil depths where analyses were not performed, an average of the concentration of the samples below and above was used. Only the data of 0–80 cm of soil was used for these calculations.
计算了土壤C、N、P和Na储量。鉴于土壤为原始砂质土,我们假设样品密度等同于土壤容重。从所采集的339个样品中,随机选取来自不同样点、处理和土壤深度的16个样品,通过称量已知体积的干样测定样品密度。其余样品的密度按TOC的函数计算(p < 0.0001,R2 = 0.91,见补充材料)。利用各样品的元素浓度计算该土层中所选元素的总质量。对于未进行分析的土层,采用其上下相邻土层样品浓度的平均值。上述计算仅采用0–80 cm土层的数据。
| Parameter 1参数 1 | # Analysis (N =)# 分析次数 (N =) | Mean±SE 2均值±标准误 2 | Median中位数 | Range范围 | DW 3 StandardsDW 3 标准 | WW 4 StandardsWW 4 标准 | Application 5 kg ha−1 y−1施用量 5 kg ha−1 y−1 |
|---|---|---|---|---|---|---|---|
| TSS | 2 | 3.3, 3.8 | 10–150 | ||||
| EC (mS m_−_1) | 121 | 68_±_1.9 | 66 | (29–167) | 100–700 | ||
TN | 2 | 46, 47 | 15–70 | 1860 | |||
| NO3−-N | 123 | 12_±_1.2 | 3.9 | (<0.005–61.8) | 11.3 | 10–50 | 480 |
| NH4+-N | 123 | 6.2_±_0.99 | 0.32 | (<0.005–37) | 248 | ||
| Inorganic N | 125 | 18_±_1.2 | 20 | (<0.005–73) | 720 | ||
TP | 2 | 6.1, 7.1 | 264 | ||||
| DR-P 6 | 123 | 1.3_±_0.2 | 0.1 | (<0.005–10) | 2–30 | 52 | |
| Ca | 2 | 11, 12 | 460 | ||||
| Mg | 2 | 3.1, 3.3 | 128 | ||||
| K | 2 | 23, 24 | 940 | ||||
| Na | 2 | 63, 65 | 2560 | ||||
| Zn (µg L_−_1) | 45 | 5.8_±_1.8 | 1.0 | (1–54) | 231 | ||
Cu (µg L_−_1) | 45 | 6.0_±_1.8 | 2.0 | (<1–59) | 2000 | 0.23 | |
| As (µg L_−_1) | 45 | 1.4_±_0.3 | <1 | (<1–10) | 10 | 0.06 | |
B (µg L_−_1) | 43 | 163_±_12 | 160 | (<5–614) | 2400 | 6.5 | |
Cd (µg L_−_1) | 45 | 0.1_±_0 | <0.06 | (<0.06–2) | 4 | 4 (g ha_−_1 y_−_1) | |
Cr (µg L_−_1) | 45 | 1.4_±_0.3 | 0.9 | (<0.15–12) | 50 | 0.06 | |
Hg (µg L_−_1) | 45 | <0.5 | <0.5 | <0.5 | 7 | <20 (g ha_−_1 y_−_1) | |
Ni (µg L_−_1) | 45 | <8 | <8 | <8 | 80 | <0.32 | |
Pb (µg L_−_1) | 125 | 1 | <1 | (<1–2) | 10 | 0.04 | |
SAR 7 | 1 | 4.4 | 8–10 |
1 Units are mg L−1, unless otherwise specified. 2 Mean ± SE: mean and standard error for parameters where N > 3; otherwise, the values are indicated. 3 DW standards: drinking water standards for NZ [30]. 4 WW standards: range from review of different countries [6]. 5 Application rate calculated for the average annual irrigation of 4000 mm y−1 and the average concentration value in the TMW. 6 DR-P: dissolved reactive phosphorus. 7 SAR: sodium adsorption ratio calculated based on Ayers and Westcot [31], using total concentration of Na, Ca, and Mg in the TMW in meq L−1. # number of samples analysed.
1 除另有说明外,单位均为mg L−1。 2 均值 ± SE:N > 3的参数给出均值和标准误,否则直接列出数值。3 DW标准:新西兰饮用水标准[30]。4 WW标准:综述不同国家标准所得的范围[6]。5 施用量按年均灌溉量4000 mm y−1和TMW中的平均浓度计算。6 DR-P:溶解性活性磷。7 SAR:钠吸附比,依据Ayers和Westcot[31],采用TMW中Na、Ca和Mg的总浓度(meq L−1)计算。# 所分析的样品数。
An analysis of variance (three-way ANOVA) was calculated to assess significant differences in soil chemical parameters depending on irrigation, plant, depth, and their interactions (Table 2). Further, a one-way ANOVA was calculated to assess differences between treatments at each depth (Supplementary Material). The model assumptions of normality and homoscedasticity were assessed by plotting the residuals in Q-Q plots and Residuals vs. Fitted plots. If the assumptions were not fulfilled, the data were Logtransformed. A Tukey’s Honestly Significant Difference test was performed to determine significant differences between groups. When assumptions were not fulfilled even after data transformations, a non-parametric Kruskall–Wallis test was used instead. The soil stocks of C, N, P, and Na were compared between treatments with a one-way ANOVA, and differences between groups were assessed with Tukey’s test. A principal component analysis (PCA) of the standardized results of the topsoil was performed, and results were plotted and grouped by treatments. These calculations were completed with RStudio version 4.2.2 (R Core Team, 2021) and the packages stats [32] and agricolae [33]. The graphs were created with the packages ggplot2 [34] and esquisse [35]. Graphs created with the colour-blind friendly palettes from viridis [36] are shown in Supplementary Material.
采用方差分析(三因素ANOVA)评估土壤化学参数在灌溉、植物、深度及其交互作用下的显著差异(表2)。此外,采用单因素ANOVA评估各深度下处理间的差异(补充材料)。通过绘制残差Q-Q图和残差–拟合值图检验模型的正态性和方差齐性假设。若不满足假设,则对数据进行对数转换。采用Tukey真实显著差异检验确定组间显著差异。若数据转换后仍不满足假设,则改用非参数Kruskal–Wallis检验。采用单因素ANOVA比较各处理间土壤C、N、P和Na储量,并用Tukey检验评估组间差异。对表土标准化结果进行主成分分析(PCA),并按处理分组作图。上述计算使用RStudio 4.2.2版(R Core Team, 2021)及stats[32]和agricolae[33]程序包完成。图形使用ggplot2[34]和esquisse[35]程序包绘制。采用viridis[36]色盲友好配色绘制的图形见补充材料。
| Parameter and Transformations参数及 数据转换 | Veg. | Irrig.灌溉 | Depth深度 | Veg×Irrig植被×灌溉 | Veg×Depth植被×深度 | Irrig×Depth灌溉×深度 | V×I×D |
|---|---|---|---|---|---|---|---|
| TP | * | * | * | * | ◦ | ||
| Log10(OlsenP + 1) | * | * | * | ◦ | |||
| Log10(P_ret) | * | * | |||||
| pH | * | * | * | * | |||
| Log10(NO3 + 1) | * | * | * | * | ◦ | * | |
| Log10(Na) | * | * | * | * | |||
| Log10(EC) | * | * | * | ||||
| Log10(TOC) | * | * | * | ||||
| Log10(TN) | * | * | * | ||||
| NH4- | * | * | * | ◦ | |||
| Mg | * | ◦ | * | ||||
| Ca | ◦ | * | * | * | |||
| K | * | * | |||||
| Log10(Cu) | * | * | * | ◦ | |||
| Mn | * | * | * | ◦ | |||
| Log10(Zn) | * | * |
Veg.: vegetation type, Irrig.: irrigation or non-irrigation. Depth: soil depth. P_ret: P retention. Level of significance: *** p < 0.001, ** p < 0.01, * p < 0.05, ◦ p < 0.1.
植被(Veg.):植被类型;灌溉(Irrig.):灌溉或未灌溉;深度(Depth):土壤深度;P_ret:磷吸持。显著性水平:*** p < 0.001,** p < 0.01,* p < 0.05,◦ p < 0.1。
3Results结果
3.1. Changes in Soil Chemical Properties3.1. 土壤化学性质的变化
The concentrations of total P and Olsen extractable P were consistently higher in soils under long-term irrigation in both types of vegetation, and this trend continued down the soil profile (Figure 2 and Table 2). In the topsoil (0–7.5 cm), long-term irrigation increased total soil P by 24% under pasture and 77% under pine, although this difference was only significant under pine according to ANOVA (Supplementary Material). The Olsen P increase due to irrigation was more pronounced, with an 85% increase under pasture and a 380% increase under pine; however, the difference was only significant under pine (Supplementary Material). A higher Olsen P concentration in irrigated areas was consistently observed in the soil profile down to the water table. Soil P was also significantly affected by vegetation type, being consistently higher under pasture than under pine. Soil P under native vegetation (kanuka) was high in the topsoil.¯ TP of 550 mg kg−1 was similar in irrigated pine and non-irrigated pasture, and Olsen P of 75 mg kg−1 was similar in both irrigated vegetation types. The soil P under kanuka significantly decreased in the deeper¯ horizons of the soil profiles, and from 60 cm deep, it was comparable to non-irrigated areas.
在两种植被类型下,长期灌溉土壤中的全P和Olsen有效P浓度均一致较高,且这一趋势沿土壤剖面向下延续(图2和表2)。在表土(0–7.5 cm)中,长期灌溉使牧场和松树下土壤全P分别增加24%和77%,但根据ANOVA,该差异仅在松树下显著(补充材料)。灌溉引起的Olsen P增幅更为明显,牧场下增加85%,松树下增加380%,但同样仅在松树下差异显著(补充材料)。在直至地下水位的土壤剖面中,均一致观察到灌溉区Olsen P浓度较高。土壤P还显著受植被类型影响,牧场下始终高于松树下。本土植被(卡努卡)下表土P含量较高:其550 mg kg−1的TP与灌溉松树和未灌溉牧场相近,75 mg kg−1的Olsen P与两种灌溉植被类型相近。卡努卡下土壤P在土壤剖面较深层显著降低,自60 cm深度起与未灌溉区相当。
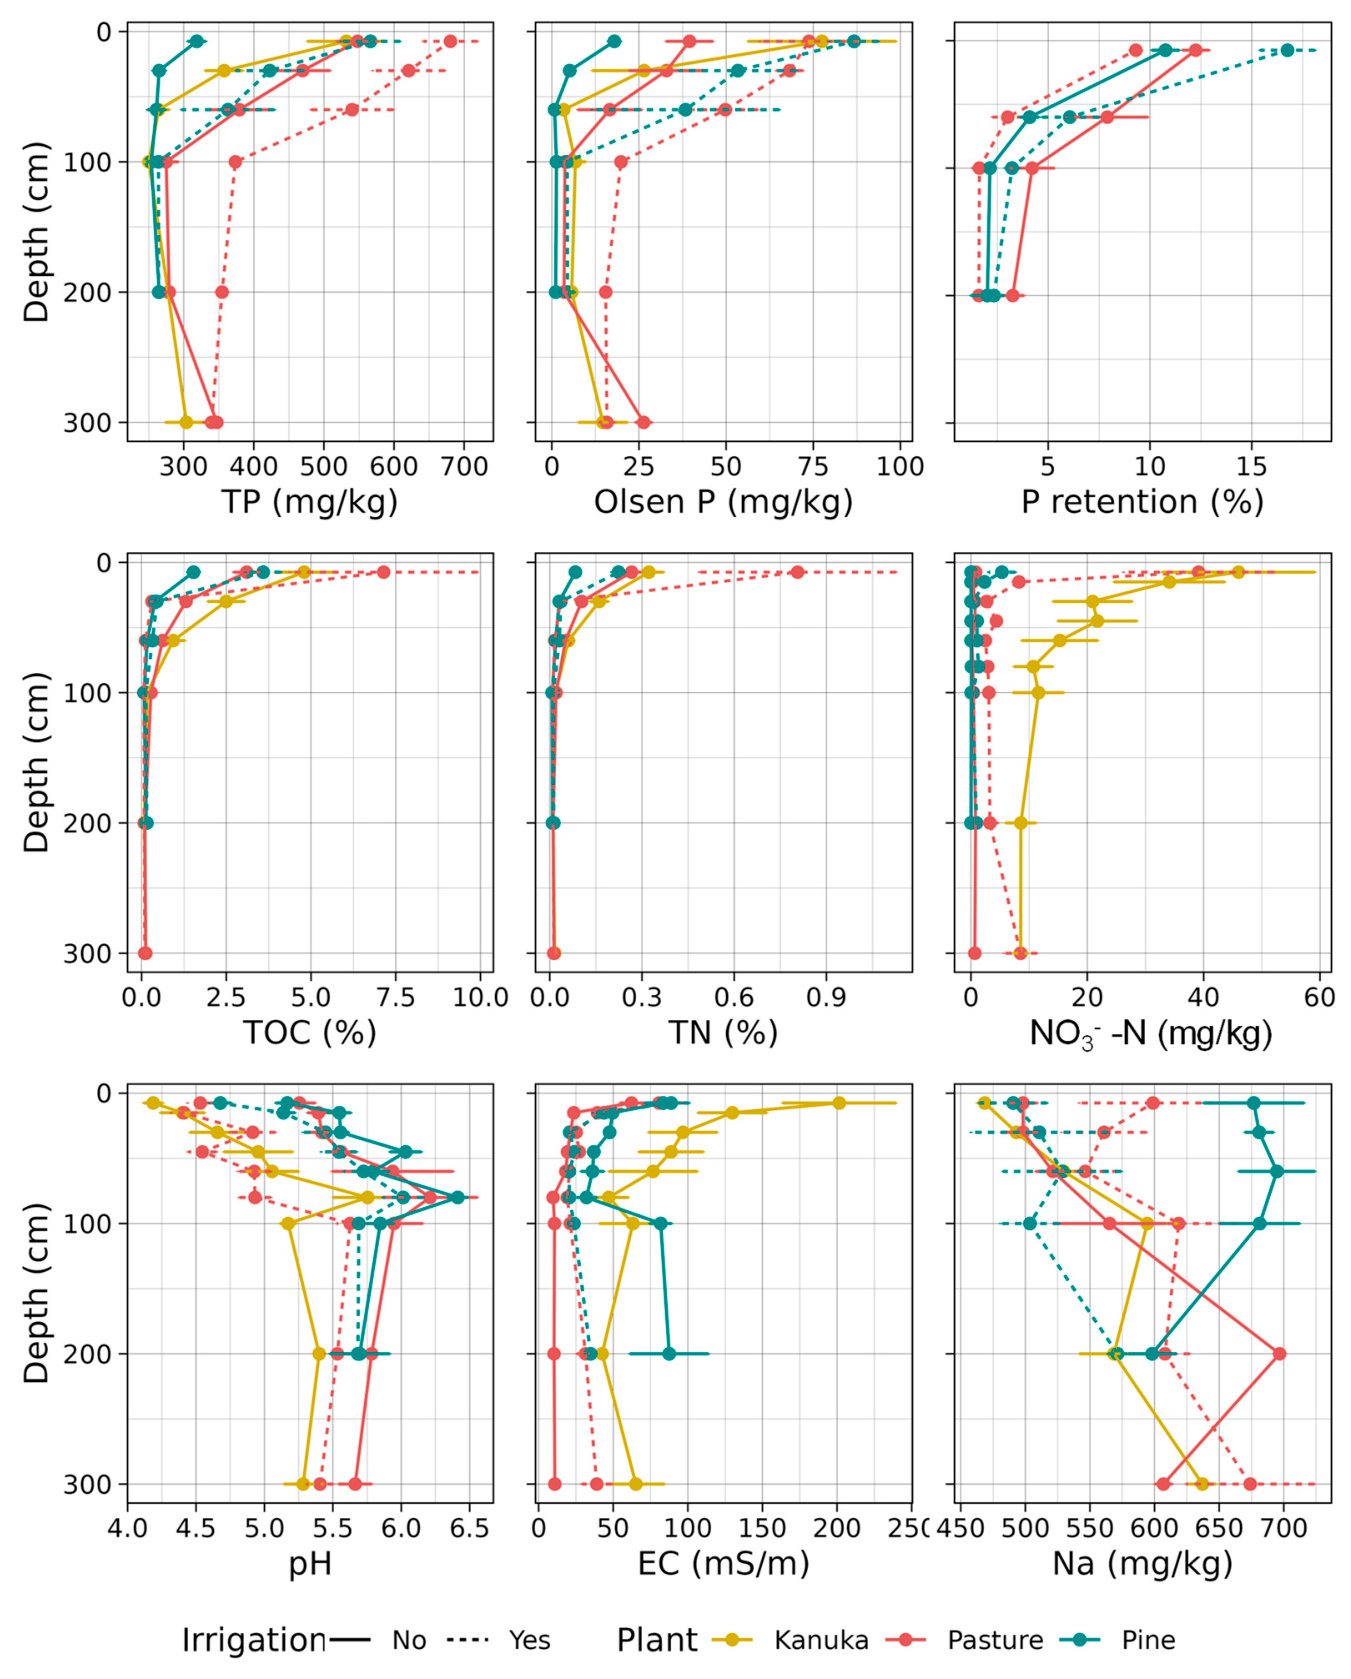
Long-term irrigation also significantly affected pH, inorganic N, and Na (Figure 2, Table 2, Supplementary Material), but the differences depended on the type of vegetation (vegetation–irrigation interaction, Table 2). Inorganic N was mostly present as NO3− in soil samples from irrigated areas and from non-irrigated areas under kanuka.¯ NH4+ was the predominant form of inorganic N in non-irrigated areas under pasture and pine. NO3− was higher in irrigated pine and pasture (5 mg kg−1 and 39 mg kg−1, respectively, in the topsoil) compared with the respective non-irrigated areas (<1 mg kg−1 in the topsoil) in all soil depths to the water table. Interestingly, soil NO3− was significantly higher in the whole soil profile under kanuka than the rest of the treatments.¯ NH4+ was less affected by irrigation than NO3− (Table 2), and it was only higher in the topsoil under irrigated pine compared to non-irrigated pine (Supplementary Material). NH4+ was mostly affected by vegetation type, being consistently higher under pasture and kanuka than under pine.¯ Most of the soil N was in the form of organic N, so the results of TN were highly correlated with TOC (Figures 2 and 3, Table 2 and Supplementary Material). TN and TOC were not significantly affected by irrigation, except as an interaction with vegetation type (Table 2). TN and TOC were higher in the topsoil under irrigated areas than under non-irrigated areas of same vegetation type (Figure 2, Supplementary Material). However, from 30 cm, this trend changes depending on the vegetation type, with generally (although not consistently significant) higher TN and TOC under non-irrigated pasture (TOC 1.3% vs. 0.3% at 30 cm) and higher TN and TOC under irrigated pine (TOC 0.32% vs. 0.16% at 60 cm). Although TN under kanuka was not different from other treatments, TOC was generally higher under¯ kanuka than under either pine treatments and irrigated pasture below the topsoil (Figure¯ 2 and Supplementary Material).
长期灌溉还显著影响pH、无机N和Na(图2、表2、补充材料),但差异取决于植被类型(植被–灌溉交互作用,表2)。在灌溉区以及卡努卡下未灌溉区的土壤样品中,无机N主要以NO3−形式存在;而在牧场和松树下的未灌溉区,NH4+是无机N的主要形态。在直至地下水位的所有土层中,灌溉松树和牧场的NO3−(表土中分别为5 mg kg−1和39 mg kg−1)均高于相应的未灌溉区(表土中<1 mg kg−1)。值得注意的是,卡努卡下整个土壤剖面的NO3−显著高于其他处理。NH4+受灌溉的影响小于NO3−(表2),仅在灌溉松树表土中高于未灌溉松树(补充材料)。NH4+主要受植被类型影响,牧场和卡努卡下始终高于松树下。土壤N大部分以有机N形式存在,因此TN结果与TOC高度相关(图2和图3、表2及补充材料)。除与植被类型的交互作用外,TN和TOC未受灌溉的显著影响(表2)。同一植被类型下,灌溉区表土的TN和TOC高于未灌溉区(图2、补充材料)。然而,自30 cm起,这一趋势随植被类型而变化:未灌溉牧场下的TN和TOC总体较高(尽管并非始终显著)(30 cm处TOC为1.3%对0.3%),而灌溉松树下的TN和TOC较高(60 cm处TOC为0.32%对0.16%)。尽管卡努卡下的TN与其他处理无差异,但在表土以下,卡努卡下的TOC总体高于两种松树处理及灌溉牧场(图2及补充材料)。
Soil pH was significantly affected by irrigation, vegetation, and the interaction of both (Table 2). Irrigation significantly decreased soil pH under both plant types (pine and pasture) in the topsoil and occasionally at deeper soil horizons (Supplementary Material). Soil under kanuka had a significantly lower pH than any other treatment, although this¯ difference was less evident at deeper soil depths (Figure 2 and Supplementary Material). Soil Na was significantly higher under irrigated than non-irrigated pasture, but only at the 0–60 cm soil depths. These results were contrary for pine, where Na was significantly lower under irrigated than non-irrigated. The soil under kanuka had a lower Na concentration in¯ the topsoil horizons than the rest of the treatments, but Na increased with depth (Figure 2). Irrigation did not affect EC and P retention results, except as an interaction with vegetation (Table 2). EC was generally higher under kanuka in the whole soil profile, similar to NO¯3− results. P retention was only different between treatments in the topsoil, where irrigated pine presented a significantly higher P retention than the rest of the treatments.
土壤pH受灌溉、植被及二者交互作用的显著影响(表2)。灌溉显著降低了两种植物类型(松树和牧场)表土的pH,在较深土层中也偶有降低(补充材料)。卡努卡下土壤pH显著低于其他所有处理,但该差异在较深土层中不太明显(图2及补充材料)。灌溉牧场下土壤Na显著高于未灌溉牧场,但仅限于0–60 cm土层。松树的结果则相反,灌溉松树下的Na显著低于未灌溉松树。卡努卡下表土层的Na浓度低于其他处理,但随深度增加而升高(图2)。除与植被的交互作用外,灌溉对EC和磷吸持结果无影响(表2)。与NO3−结果类似,卡努卡下整个土壤剖面的EC总体较高。磷吸持仅在表土中存在处理间差异,其中灌溉松树的磷吸持显著高于其他处理。
The rest of the parameters analysed, i.e., Mg, K, Ca, Mn, and Cu, were not strongly affected by irrigation or the interaction with vegetation (Table 2). K and Ca were significantly lower in irrigated than in non-irrigated soil. However, this difference was minimal (Ca: 0.74% vs. 0.76%, K: 0.12% vs. 0.14%) and non-significant in the ANOVA (Supplementary Material). Mn was significantly lower in irrigated soil than in non-irrigated soil (203 mg kg−1 vs. 217 mg kg−1). Although the ANOVA test identified a significant effect of irrigation on soil Mg and Cu, Tukey’s test did not significantly differentiate the irrigated vs. non-irrigated. Zn was not significantly affected by irrigation. The rest of the analysed trace elements (Cd, Pb, Cr, Ni, As, Hg) were below the detection limit in the soil or did not present significant differences between irrigation vs. non-irrigation or between plant species.
其余所分析的参数,即Mg、K、Ca、Mn和Cu,受灌溉或其与植被交互作用的影响不大(表2)。灌溉土壤中的K和Ca显著低于未灌溉土壤,但差异极小(Ca:0.74%对0.76%;K:0.12%对0.14%),且在ANOVA中不显著(补充材料)。灌溉土壤中的Mn显著低于未灌溉土壤(203 mg kg−1对217 mg kg−1)。尽管ANOVA检验表明灌溉对土壤Mg和Cu有显著影响,但Tukey检验未能显著区分灌溉与未灌溉处理。Zn未受灌溉的显著影响。其余所分析的微量元素(Cd、Pb、Cr、Ni、As、Hg)在土壤中低于检出限,或在灌溉与未灌溉之间、不同植物种类之间无显著差异。
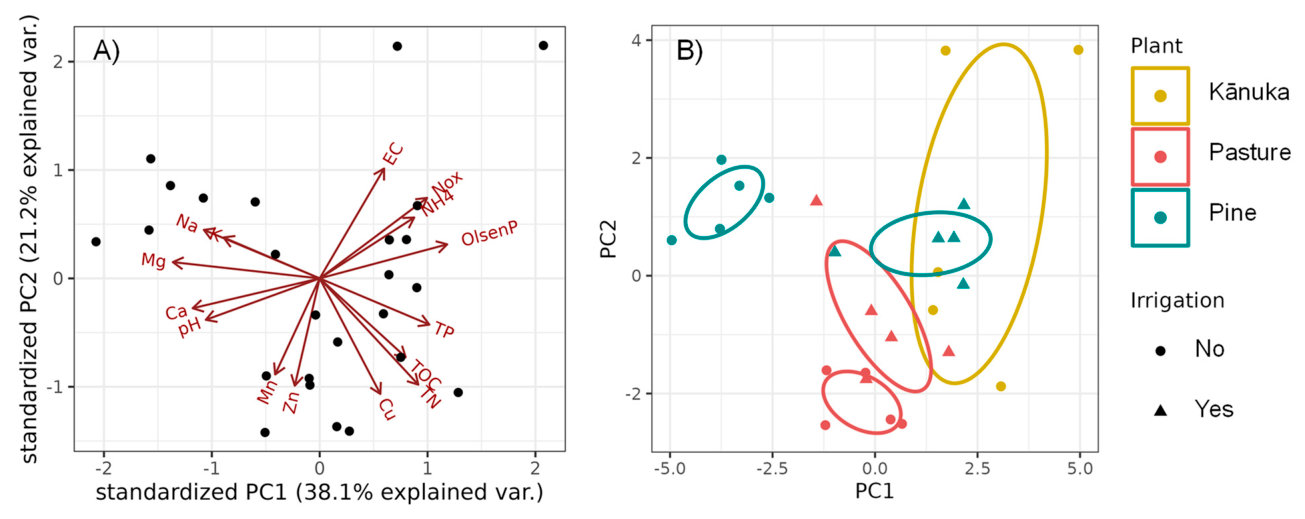
A PCA demonstrated that the chemical parameters in the topsoil (where the biggest differences were identified) were generally different between vegetation type and irrigation (Figure 3). The two first components of the PCA (Figure 3) explained 59.3% of the variance in the topsoil. The grouping of the soil results (Figure 3B) clearly differentiated between vegetation type and irrigation, indicating that soil chemical parameters depended on both irrigation and vegetation type. The variability of results was greater in soil under kanuka¯ compared with the other treatments.
PCA表明,表土(差异最大的层次)中的化学参数总体上因植被类型和灌溉而异(图3)。PCA的前两个主成分(图3)解释了表土中59.3%的方差。土壤结果的分组(图3B)清晰地区分了植被类型和灌溉,表明土壤化学参数同时取决于灌溉和植被类型。与其他处理相比,卡努卡下土壤结果的变异性更大。
3.2. Changes in Soil Stocks3.2. 土壤储量的变化
The soil stocks of C, N, P, and Na in the 0–80 cm of soil under each vegetation type and irrigation and non-irrigation are shown in Figure 4. Irrigation with TMW did not result in significant differences in C stocks, and the differences depended on vegetation type. Soil carbon stocks were most variable under kanuka, varying from 50 t ha¯−1 to >300 t ha−1. Soil C stock under kanuka (~130 t ha¯−1) was significantly higher than in soil under irrigated pasture and non-irrigated pine (<50 t ha−1). C stocks in soil under non-irrigated pasture (~100 t ha−1) were significantly higher than under non-irrigated pine. Similarly to C, soil N stocks did not differ between irrigated and non-irrigated areas, and the biggest difference was found between kanuka and pasture (~7–10 t N ha¯−1) with significantly higher N stock than pine (<5 t N ha−1).
图4给出了各植被类型灌溉与未灌溉条件下0–80 cm土层的土壤C、N、P和Na储量。TMW灌溉未导致C储量产生显著差异,差异取决于植被类型。卡努卡下土壤碳储量变异最大,从50 t ha−1到>300 t ha−1不等。卡努卡下土壤C储量(~130 t ha−1)显著高于灌溉牧场和未灌溉松树下的土壤(<50 t ha−1)。未灌溉牧场下土壤C储量(~100 t ha−1)显著高于未灌溉松树。与C类似,土壤N储量在灌溉区与未灌溉区之间无差异,最大差异出现在卡努卡和牧场(~7–10 t N ha−1)与松树之间,前两者的N储量显著高于松树(<5 t N ha−1)。
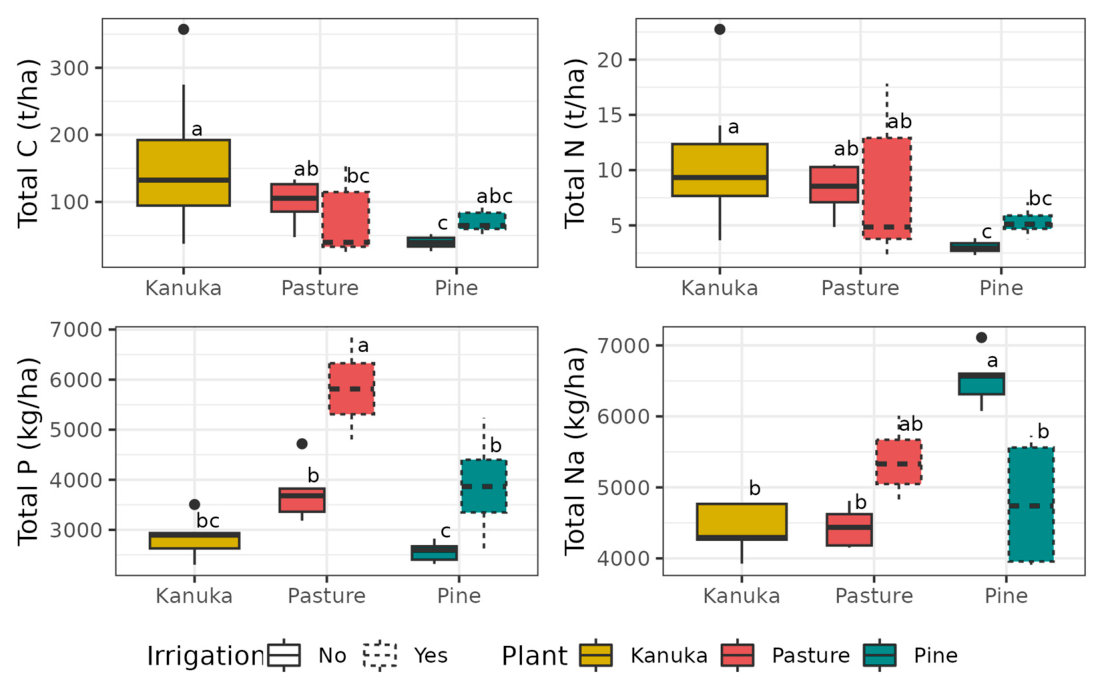
Irrigation had the largest effect on soil stocks of P and Na. Soil P stocks under kanuka¯ were similar to unirrigated pasture and pine, although there was a significant difference between the last two (3.7 t ha−1 under pasture compared with 2.6 t ha−1 under pine). Long-term irrigation significantly increased the soil P stocks in both irrigated vegetation types, up to 6 t ha−1 under pasture and nearly 4 t ha−1 under pine. Na stocks were significantly higher under non-irrigated pine (6.5 t ha−1) than irrigated pine (4.7 t ha−1).
灌溉对土壤P和Na储量的影响最大。卡努卡下的土壤P储量与未灌溉牧场和松树相近,但后两者之间存在显著差异(牧场下为3.7 t ha−1,松树下为2.6 t ha−1)。长期灌溉显著提高了两种灌溉植被类型下的土壤P储量,牧场下高达6 t ha−1,松树下接近4 t ha−1。未灌溉松树下的Na储量(6.5 t ha−1)显著高于灌溉松树(4.7 t ha−1)。
4Discussion讨论
4.1. Changes in Soil Chemical Properties4.1. 土壤化学性质的变化
The accumulation of P in the soil profile due to TMW irrigation was consistent across vegetation types (Figure 2, Table 2), which is consistent with the general literature showing an increase in total and available P down the soil profile after long-term (>10 years) wastewater irrigation [13,14,18,20,37]. This is not surprising as P was applied at a high rate with TMW irrigation (Table 1). The average Olsen P concentration in the irrigated topsoil of 87 mg kg−1 under pine was within the adequate range of Olsen P required for pine forestry (50–100 mg kg−1, according to NZ soil quality indicators [38]). However, Olsen P of 74 mg kg−1 under pasture was higher than the adequate range for this type of vegetation (20–50 mg kg−1, [38]). This indicates that the accumulation of P in the soil can limit the future use of the area for P-susceptible plant species. Some authors [39,40] considered that the build-up of P in the soil is a factor affecting the lifespan of TMW irrigation areas and their future use.
TMW灌溉导致的土壤剖面P累积在各植被类型间表现一致(图2、表2),这与一般文献报道的长期(>10年)污水灌溉后全P和有效P沿土壤剖面向下增加的结果一致[13,14,18,20,37]。这并不意外,因为TMW灌溉的P施用量很高(表1)。松树下灌溉表土的平均Olsen P浓度为87 mg kg−1,处于松树人工林所需Olsen P的适宜范围内(50–100 mg kg−1,依据新西兰土壤质量指标[38])。然而,牧场下74 mg kg−1的Olsen P高于该植被类型的适宜范围(20–50 mg kg−1,[38])。这表明土壤P累积可能限制该区域未来对P敏感植物种类的利用。部分作者[39,40]认为,土壤中P的累积是影响TMW灌溉区使用年限及其未来用途的一个因素。
The effect of irrigation on soil N was less consistent than for P and depended on the type of vegetation, as also demonstrated previously [25]. TN and TOC results were similar, mostly due to N being predominantly present in organic form. The fact that, in some instances, NO3− and TN (and TOC) concentrations in soil are higher under irrigated areas is consistent with some of the literature showing similar trends [10,13,41–45]. However, these results were not consistent for both plant species at all soil depths and all forms of N (TN, NO3− and NH4+), highlighting the complex N cycling processes in the soil with a myriad of compounding factors [25,46]. This may also explain the range of responses in soil N after long-term TMW irrigation, which includes an increase in TN and/or inorganic N with irrigation [10,13,41–43] or no differences [8,43,47]. Interestingly, the soil under kanuka¯ had a consistently higher concentration of NO3− down the soil profile than under any other treatment, including irrigated or non-irrigated vegetation, even when TN in the soil was not significantly higher (Figure 2 and Supplementary Material). This suggests that kanuka,¯ or its associated microorganisms [48], are more efficient at mineralising N from soil organic matter than pine and pasture. This contrasts with previous research indicating a potential nitrification inhibition by k¯anuka and other Myrtaceae NZ native plants [23,24].
灌溉对土壤N的影响不如对P一致,且取决于植被类型,这与先前的研究结果一致[25]。TN和TOC的结果相似,主要是因为N主要以有机形态存在。在某些情况下,灌溉区土壤中NO3−和TN(及TOC)浓度较高,这与部分文献显示的类似趋势一致[10,13,41–45]。然而,这些结果在两种植物种类、所有土层以及所有N形态(TN、NO3−和NH4+)之间并不一致,凸显了土壤中受众多复合因素影响的复杂N循环过程[25,46]。这也可以解释长期TMW灌溉后土壤N响应的多样性,包括灌溉导致TN和/或无机N增加[10,13,41–43]或无差异[8,43,47]。值得注意的是,即使土壤TN并未显著较高,卡努卡下沿土壤剖面的NO3−浓度也始终高于其他任何处理,包括灌溉或未灌溉的植被(图2及补充材料)。这表明卡努卡或其相关微生物[48]在矿化土壤有机质中的N方面比松树和牧草更高效。这与先前研究表明卡努卡及其他新西兰本土桃金娘科植物可能具有硝化抑制作用的结果相悖[23,24]。
Contrary to general findings of Na soil accumulation after long-term TMW irrigation [10,14,20], this research did not show a consistently higher Na soil concentration in irrigated areas compared with non-irrigated areas, nor an increase in EC with irrigation (Figures 2 and 4, and Supplementary Material). Furthermore, under pine plantation, Na was higher at all soil depths in the non-irrigated areas compared to irrigated areas, and EC was higher at some soil depths (Figures 2 and 4, Supplementary Material). Although Na concentration in TMW (=2.78 meq L−1, Table 1) was within the recommended concentration for irrigation water (<3 meq L−1, [31]), its relation to other cations, as indicated by a SAR of 4.4, together with a moderate EC (68 mS m−1), indicates that this TMW should have a moderate restriction on use [31]. Irrigation with saline TMW over long periods of time can affect soil structure by clay dispersion [22] and has been shown to decrease infiltration rates over time [19,20]. Although the infiltration rate was not analysed in our study, the lack of evidence of Na accumulation, and the fact that the area is still used for TMW irrigation without any infiltration issues, indicate that soil salinity and sodicity are not problems in this region. This is likely due to the sandy texture of the soil, which is Sandy Recent soil formed over old dunes [49] with likely low CEC and, thus, low Na accumulation potential. Furthermore, the high irrigation rate (~4 m y−1) together with high annual rainfall (1000–1100 mm y−1) evenly distributed over the year, with mild summer temperatures rarely exceeding 25 ◦C and an average annual evapotranspiration of 900 mm (and so without a period of significant water deficit) [50], likely resulted in the leaching of excess salts out of the soil. The higher concentration of Na in soil under non-irrigated pine, although surprising, could potentially be explained by microclimate conditions in the area, with a higher salt spray from the nearby ocean in the sampling area of unirrigated pine compared with other areas, as seen in Figure 1. Another explanation could be the different soil moisture and soil hydrology under pine plantations resulting from decreased rainfall infiltration due to canopy interception. In a review study, Rowe and colleagues [51] calculated that the range of throughfall rain in pine canopy was between 50 to 80% of the annual rainfall. In a recent study under Leptospermum scoparium (Myrtaceae) canopy, [52] it was demonstrated that throughfall rain was ~60% less than total rainfall, and it was suggested this was the main reason for the measured lower soil moisture and higher Na soil concentration under manuka canopy than pasture.¯ Given the proximity of unirrigated pine sampling areas to the irrigated pine and pasture, rain interception is likely to partially explain the increase in Na in the soil. Given that the area under kanuka is¯ further from the sea and separated from the other sampled areas by a range of dunes, it is likely that the different microclimate and the salt-spray effect explain the difference in this vegetation type.
与长期TMW灌溉后土壤Na累积的普遍结论相反[10,14,20],本研究并未发现灌溉区土壤Na浓度始终高于未灌溉区,也未发现灌溉导致EC升高(图2和图4及补充材料)。此外,在松树人工林下,未灌溉区所有土层的Na均高于灌溉区,且部分土层的EC也较高(图2和图4、补充材料)。尽管TMW中的Na浓度(=2.78 meq L−1,表1)处于灌溉用水的推荐浓度范围内(<3 meq L−1,[31]),但其与其他阳离子的关系(SAR为4.4)以及中等的EC(68 mS m−1)表明,该TMW的使用应受到中等程度的限制[31]。长期使用含盐TMW灌溉可因黏粒分散而影响土壤结构[22],并已被证明会随时间推移降低入渗速率[19,20]。尽管本研究未分析入渗速率,但缺乏Na累积的证据,且该区域至今仍用于TMW灌溉而未出现入渗问题,表明土壤盐化和钠质化在该区域并非问题。这可能归因于土壤的砂质质地:该土壤为发育于古沙丘上的砂质新成土[49],其CEC可能较低,因而Na累积潜力较低。此外,高灌溉速率(~4 m y−1),加之全年分布均匀的高年降雨量(1000–1100 mm y−1)、夏季温和(气温很少超过25 ◦C)以及年均蒸散量900 mm(因而不存在明显的水分亏缺期)[50],很可能使过量盐分淋溶出土壤。未灌溉松树下土壤Na浓度较高虽出人意料,但可能可以用该区域的小气候条件来解释:如图1所示,与其他区域相比,未灌溉松树采样区受附近海洋的盐雾影响更大。另一种解释可能是松树人工林下林冠截留导致降雨入渗减少,从而造成土壤湿度和土壤水文状况的差异。Rowe及其同事[51]在一项综述研究中计算得出,松树林冠下的穿透雨量为年降雨量的50%至80%。在最近一项针对Leptospermum scoparium(桃金娘科)林冠的研究中[52],证明穿透雨量比总降雨量少~60%,并认为这是麦卢卡林冠下土壤湿度低于牧场、土壤Na浓度高于牧场的主要原因。鉴于未灌溉松树采样区与灌溉松树和牧场相邻,降雨截留很可能部分解释了土壤Na的增加。鉴于卡努卡区域距海更远,且与其他采样区之间隔有一系列沙丘,不同的小气候和盐雾效应很可能解释了该植被类型下的差异。
4.2. Exports of Contaminants and Soil Nutrient Stocks4.2. 污染物输出与土壤养分储量
The significant P accumulation found in the TMW-irrigated soil poses a risk to nearby waterbodies, where an excessive concentration of this nutrient can exacerbate eutrophication. Although most of the exports of soil P to waterbodies are attributed to run-off [53], there is evidence that P from wastewater-irrigated areas can also leach in large quantities to groundwater [37,54]. In accordance with [20,37,54], the fact that we found significantly higher concentrations of P through the soil profile and down to the water table level under irrigated areas compared with non-irrigated areas demonstrated the movement of P down the soil profile.
TMW灌溉土壤中显著的P累积对附近水体构成风险,该养分浓度过高会加剧富营养化。尽管土壤P向水体的输出大多归因于地表径流[53],但有证据表明,污水灌溉区的P也可大量淋溶至地下水[37,54]。与[20,37,54]的结果一致,我们发现灌溉区整个土壤剖面直至地下水位处的P浓度均显著高于未灌溉区,这证明了P沿土壤剖面向下迁移。
The fact that the significant increase in soil P stocks (Figure 4) in the irrigated areas cannot account for the total P application of ~7.9 t ha−1 over 30 years indicates the likelihood of P leaching to groundwater. Under pasture, the total accumulation of P in the soil under irrigated areas was, on average, 2 t ha−1 higher than under non-irrigated areas. Under pine, this increase was 1.3 t ha−1. In a mass balance estimation, the total P inputs by TMW irrigation (Table 1) must have been either accumulated into the soil (Figure 4), either taken up by vegetation, or lost to groundwater. That indicates that ~6 t ha−1 and ~6.6 t ha−1 of P have been lost under pasture and pine, respectively, over the course of 30 years of TMW application. The P uptake by the pine plantation could be estimated by the following: (a) using the NZ Ministry of Primary Industries C sequestration estimates for a 30-year-old radiata pine plantation (~900 t CO2 eq. ha−1 [55]) and (b) transforming this estimate into C and into P by using C:P stoichiometry of a range of wood trees [56] or coniferous trees [57]. With this estimation, the P uptake by pine trees was ~50–300 kg P ha−1 over 30 years. Will [58] calculated that fertilised pine plantations can uptake an extra ~30 kg P ha−1 over 8 years compared with unfertilised. This means that under pine plantation, the area has lost an estimated average of 215 kg P ha−1 y−1 or 80% of the total P applied. In the case of pasture, and supposing a best-case scenario of a cut-and-carry system with highly productive pasture [39] with an annual P removal with vegetation of 45 kg P ha−1, the estimated losses of P are 155 kg P ha−1 y−1 or 60% of applied P.
灌溉区土壤P储量的显著增加(图4)无法解释30年间~7.9 t ha−1的总P施用量,这表明P很可能淋溶至地下水。在牧场下,灌溉区土壤P总累积量平均比未灌溉区高2 t ha−1;在松树下,这一增量为1.3 t ha−1。根据质量平衡估算,TMW灌溉的总P输入(表1)必然或累积于土壤中(图4),或被植被吸收,或损失至地下水。这表明在30年的TMW施用期间,牧场和松树下分别损失了~6 t ha−1和~6.6 t ha−1的P。松树人工林的P吸收量可通过以下方式估算:(a)采用新西兰初级产业部对30年生辐射松人工林的C固存估算值(~900 t CO2 eq. ha−1[55]);(b)利用多种木本树种[56]或针叶树[57]的C:P化学计量比,将该估算值换算为C再换算为P。据此估算,30年间松树的P吸收量为~50–300 kg P ha−1。Will[58]计算得出,与未施肥松树人工林相比,施肥松树人工林在8年间可额外吸收~30 kg P ha−1。这意味着在松树人工林下,该区域平均估计损失215 kg P ha−1 y−1,即施入总P的80%。对于牧场,假设在高产牧场刈割移出系统的最佳情景下[39],植被每年移出P 45 kg P ha−1,则P的估计损失量为155 kg P ha−1 y−1,即施入P的60%。
Contrary to P, there was no evidence of N accumulation in the soil due to long-term TMW irrigation (Figure 4). Using similar mass balance calculations and the same sources [55–57], the estimated N uptake over 30 years is 1–3 t N ha−1 by pine plantation and 9.4 t N ha−1 by pasture. This indicates a loss of N of >1700 kg N ha−1 y−1 (~96% of the applied N) under pine plantation and >1500 kg N ha−1 y−1 (~83% of the applied N) under pasture. Nitrogen may have been lost to groundwater via leaching or to the atmosphere via denitrification. In a meta-analysis of >200 studies [59], the average N loss from soil through denitrification was calculated to be 4.8% of the applied N as fertiliser or manure, 33% of which was as N2O. In very wet areas—as could be the case in our research due to high irrigation with 4 m y−1— the increased denitrification rate due to applied N could be up to 27%, as was the case in paddy fields reviewed by [59]. A global mass balance of N in terrestrial ecosystems [60] calculated that N2O is ~12% of the denitrification emissions. This indicates that it is likely that most of the losses of N are via leaching to groundwater (eq. ~1600 kg N ha−1 y−1 under pine and ~1400 kg N ha−1 y−1 under pasture, or ~1000–1300 kg N ha−1 y−1 in a situation similar to paddy fields due to high irrigation). Assuming N2O ratios as an average of the global average values calculated by [59,60], potentially, N2O emissions from this area would be 28 kg N2O ha−1 y−1 under pine and 25 kg N2O ha−1 y−1 under pasture, which equates to 8.5 t CO2 eq. ha−1 y−1 and 7.4 t CO2 eq. ha−1 y−1. This represents about one-quarter of the potential carbon sequestration by pine [55] plantations over 30 years.
与P相反,没有证据表明长期TMW灌溉导致土壤N累积(图4)。采用类似的质量平衡计算和相同的数据来源[55–57],估算30年间松树人工林的N吸收量为1–3 t N ha−1,牧场为9.4 t N ha−1。这表明松树人工林下N损失量>1700 kg N ha−1 y−1(施入N的~96%),牧场下>1500 kg N ha−1 y−1(施入N的~83%)。N可能通过淋溶损失至地下水,或通过反硝化作用损失至大气。一项涵盖>200项研究的荟萃分析[59]计算得出,以化肥或粪肥形式施入的N经反硝化作用从土壤中损失的平均比例为4.8%,其中33%以N2O形式损失。在非常湿润的区域——如本研究因4 m y−1的高灌溉量而可能出现的情况——施入N引起的反硝化速率增量可高达27%,正如[59]所综述的稻田情况。一项陆地生态系统N的全球质量平衡研究[60]计算得出,N2O约占反硝化排放的~12%。这表明N损失很可能主要通过淋溶进入地下水(相当于松树下~1600 kg N ha−1 y−1、牧场下~1400 kg N ha−1 y−1;若因高灌溉量而出现类似稻田的情况,则为~1000–1300 kg N ha−1 y−1)。若采用[59,60]所计算全球平均值的平均数作为N2O比例,则该区域的N2O排放量在松树下可能为28 kg N2O ha−1 y−1,在牧场下为25 kg N2O ha−1 y−1,分别相当于8.5 t CO2 eq. ha−1 y−1和7.4 t CO2 eq. ha−1 y−1。这约相当于松树人工林30年间潜在碳固存量[55]的四分之一。
Soil C concentrations were higher in the topsoil of irrigated areas (Figure 2, Supplementary Material), which agrees with the general literature [45,61]. Despite that, the C stocks were not influenced by irrigation (Figure 4), mostly due to the strong decrease in bulk density, which is an exponential function of soil C concentration (Supplementary Material). It is challenging to compare our results with the other literature since most reports claiming changes in soil C pools or stocks base their assumptions on soil C concentrations [44,45,61] and use a generic and constant soil density for transforming C concentration to Mg ha−1. As we have demonstrated in this work, that approach can significantly overestimate the real soil C pools and drive erroneous conclusions about the effects of different practices on soil carbon sequestration. Nevertheless, the results reported by Sánchez–González and colleagues [61] indicated that, despite an increase in soil C after untreated wastewater irrigation, soil C concentrations were lower than in the natural forest. This agrees with our results showing generally higher C stock in soil under kanuka than in any other sampled¯ area. Authors attributed these differences to losses of C during the conversion of forest land to crops due to the degradation of soil structure and higher mineralisation of organic matter. Our results show that soil C stocks are more related to the type of vegetation growing in the soil than to irrigation (Figure 4). The fact that C stocks were higher under pasture than pine agrees with the previous literature [62]. However, the difference was more pronounced in our study, with C stocks under unirrigated pine 50% lower than under unirrigated pasture, while the difference in the mentioned study [62] was only 11–33%.
灌溉区表土的土壤C浓度较高(图2、补充材料),这与一般文献一致[45,61]。尽管如此,C储量并未受灌溉影响(图4),这主要是由于容重大幅降低,而容重是土壤C浓度的指数函数(补充材料)。由于大多数声称土壤C库或储量发生变化的报道都以土壤C浓度为依据[44,45,61],并采用通用且恒定的土壤容重将C浓度换算为Mg ha−1,因此难以将本研究结果与其他文献进行比较。正如本研究所证明的,这种方法可能显著高估实际土壤C库,并导致关于不同管理措施对土壤碳固存影响的错误结论。尽管如此,Sánchez–González及其同事[61]报道的结果表明,虽然未处理污水灌溉后土壤C有所增加,但土壤C浓度仍低于天然林。这与本研究结果一致,即卡努卡下土壤C储量总体高于其他任何采样区域。作者将这些差异归因于林地转为农田过程中土壤结构退化和有机质矿化加剧所造成的C损失。本研究结果表明,土壤C储量与土壤上生长的植被类型的关系比与灌溉的关系更密切(图4)。牧场下C储量高于松树下,这与先前文献一致[62]。然而,本研究中的差异更为明显:未灌溉松树下的C储量比未灌溉牧场低50%,而上述研究[62]中的差异仅为11–33%。
5Conclusions结论
The type of vegetation established in areas irrigated with treated municipal wastewater can have as much effect on the resulting soil quality as the irrigation itself. This was demonstrated for pH, EC, N, C, and Na. In contrast, P was consistently higher in irrigated areas of both pasture and pine and down the soil profile until the water table. Soil P accumulation, which could potentially cause toxicity in less tolerant plants, is the only evidence of soil degradation since there was no significant accumulation of Na or trace elements in the soil. Excess losses of nutrients to groundwater and/or the atmosphere were identified as the biggest negative environmental impacts of this irrigation scheme. A mass balance estimated that the loss of P to groundwater was approximately 215 kg P ha−1 y−1 under pine and 155 kg P ha−1 y−1 under pasture. The loss of N to groundwater was estimated at 1300–1600 kg N ha−1 y−1 under pine and 1000–1400 kg N ha−1 y−1 under pasture. Emissions of N2O were estimated to be up to 28 kg N2O ha−1 y−1. Designing systems that take into consideration the specific remediation potential of the vegetation to be irrigated is fundamental to protecting the soil, the water, and the atmosphere. Despite that, irrigation rates must not exceed the capacity of plants to uptake nutrients or contaminants if irrigation systems are to be sustainable in the long term.
在以处理后城市污水灌溉的区域,所种植的植被类型对最终土壤质量的影响可与灌溉本身相当。这一点在pH、EC、N、C和Na上得到了证明。相比之下,在牧场和松树的灌溉区,P均一致较高,且直至地下水位的整个土壤剖面皆如此。土壤P累积可能对耐受性较差的植物造成毒害,这是土壤退化的唯一证据,因为土壤中未出现Na或微量元素的显著累积。养分向地下水和/或大气的过量损失被确定为该灌溉方案最主要的负面环境影响。质量平衡估算表明,P向地下水的损失量在松树下约为215 kg P ha−1 y−1,在牧场下约为155 kg P ha−1 y−1。N向地下水的损失量估计在松树下为1300–1600 kg N ha−1 y−1,在牧场下为1000–1400 kg N ha−1 y−1。N2O排放量估计最高可达28 kg N2O ha−1 y−1。设计考虑所灌溉植被特定修复潜力的系统,对于保护土壤、水体和大气至关重要。尽管如此,若要使灌溉系统长期可持续,灌溉速率不得超过植物吸收养分或污染物的能力。
Supplementary Materials: The following supporting information can be downloaded at: https: //www.mdpi.com/article/10.3390/su152316230/s1, Interpolation of sample density based on soil C concentration; Table S1: Results of chemical analysis in the soil; Table S2: Results of chemical analysis in the soil (continuation). Figure S1. Relationship between soil C concentration and sample density. Figure S2. Average and standard error of the soil parameters at the different treatments (irrigated vs. non-irrigated, pine vs. pasture vs. kanuka) and at increasing soil depths.¯ Figure S3. Principal component analysis of the chemical results in the topsoil (0–7.5 cm). (A) Biplot with the variable weighting and the scatterplot. (B) Scatterplot with groups based on plant and irrigation. Ellipse shows confidence regions. Figure S4. Boxplots of the element stocks in the soil (0–80 cm) calculated per hectare. Different letters in each graph indicate significant differences between groups (Tukey’s test, p < 0.05).
补充材料:以下支撑信息可从https: //www.mdpi.com/article/10.3390/su152316230/s1下载:基于土壤C浓度的样品密度插值;表S1:土壤化学分析结果;表S2:土壤化学分析结果(续)。图S1. 土壤C浓度与样品密度的关系。图S2. 不同处理(灌溉与未灌溉;松树、牧场与卡努卡)下各土壤深度土壤参数的平均值和标准误。图S3. 表土(0–7.5 cm)化学结果的主成分分析。(A)含变量载荷与散点图的双标图。(B)按植物和灌溉分组的散点图。椭圆表示置信区域。图S4. 以每公顷计算的土壤(0–80 cm)元素储量箱线图。各图中不同字母表示组间差异显著(Tukey检验,p < 0.05)。
Author Contributions: Conceptualization, B.H.R. and J.H.; methodology, M.J.G.-G., S.H., I.A. and V.A.; formal analysis, M.J.G.-G., S.H., I.A. and V.A.; investigation, M.J.G.-G., B.H.R. and J.H.; resources, H.L.; data curation, M.J.G.-G.; writing—original draft preparation, M.J.G.-G.; writing—review and editing, M.J.G.-G., S.H., I.A., B.H.R., H.L., J.H. and V.A.; visualization, M.J.G.-G.; project administration, H.L.; funding acquisition, H.L., B.H.R. and J.H. All authors have read and agreed to the published version of the manuscript.
作者贡献:研究构思,B.H.R.和J.H.;方法,M.J.G.-G.、S.H.、I.A.和V.A.;形式分析,M.J.G.-G.、S.H.、I.A.和V.A.;调查研究,M.J.G.-G.、B.H.R.和J.H.;资源,H.L.;数据管理,M.J.G.-G.;初稿撰写,M.J.G.-G.;审阅与编辑,M.J.G.-G.、S.H.、I.A.、B.H.R.、H.L.、J.H.和V.A.;可视化,M.J.G.-G.;项目管理,H.L.;经费获取,H.L.、B.H.R.和J.H.。所有作者均已阅读并同意发表版本的稿件。
Funding: This study was funded by the Ministry for the Environment of New Zealand’s Freshwater Improvement Fund [grant number 22127] and the Institute of Environmental Science and Research Ltd. (ESR) Strategic Science Investment Funding from the Ministry of Business, Innovation and Employment, New Zealand [grant number C03X1701], under a Pioneer Project and Native Ecosystems Project.
基金资助:本研究由新西兰环境部淡水改善基金(Freshwater Improvement Fund)[资助号22127]以及新西兰商业、创新和就业部向环境科学与研究所(ESR)提供的战略科学投资基金[资助号C03X1701]资助,属于先锋项目(Pioneer Project)和本土生态系统项目(Native Ecosystems Project)。
Institutional Review Board Statement: Not applicable.机构审查委员会声明:不适用。
Informed Consent Statement: Not applicable.知情同意声明:不适用。
Data Availability Statement: The data presented in this study are available on request from the corresponding author.
数据可用性声明:本研究所呈现的数据可向通讯作者索取。
Acknowledgments: We would like to acknowledge the considerable work of Charlotte Sitz in helping with the soil collection.
致谢:感谢Charlotte Sitz在土壤采集工作中付出的大量努力。
Conflicts of Interest: Author Hamish Lowe is director of the company Lowe Environmental Impact, who collaborated in the application for research funds, and managed and administered the project. The authors declare that the research was conducted in the absence of any commercial or financial relationships that could be construed as a potential conflict of interest.
利益冲突:作者Hamish Lowe为Lowe Environmental Impact公司董事,该公司参与了研究经费的申请,并负责项目的管理与行政工作。作者声明,本研究不存在任何可能被视为潜在利益冲突的商业或财务关系。
References参考文献
1. WWAP (United Nations World Water Assessment Programme). The United Nations World Water Development Report 2017. Wastewater: The Untapped Resource; UNESCO: Paris, France, 2017.
2. Krzmarzick, M.J.; Novak, P.J. Removal of chlorinated organic compounds during wastewater treatment: Achievements and limits. Appl. Microbiol. Biotechnol. 2014, 98, 6233–6242. [CrossRef]
3. Preisner, M.; Neverova-Dziopak, E.; Kowalewski, Z. An Analytical Review of Different Approaches to Wastewater Discharge Standards with Particular Emphasis on Nutrients. Environ. Manag. 2020, 66, 694–708. [CrossRef] [PubMed]
4. Rout, P.R.; Shahid, M.K.; Dash, R.R.; Bhunia, P.; Liu, D.; Varjani, S.; Zhang, T.C.; Surampalli, R.Y. Nutrient removal from domestic wastewater: A comprehensive review on conventional and advanced technologies. J. Environ. Manag. 2021, 296, 113246. [CrossRef] [PubMed]
5. Pedrero, F.; Kalavrouziotis, I.; Alarcón, J.J.; Koukoulakis, P.; Asano, T. Use of treated municipal wastewater in irrigated agriculture— Review of some practices in Spain and Greece. Agric. Water Manag. 2010, 97, 1233–1241. [CrossRef]
6. Becerra-Castro, C.; Lopes, A.R.; Vaz-Moreira, I.; Silva, E.F.; Manaia, C.M.; Nunes, O.C. Wastewater reuse in irrigation: A microbiological perspective on implications in soil fertility and human and environmental health. Environ. Int. 2015, 75, 117–135. [CrossRef]
7. Overcash, M.; Sims, R.C.; Sims, J.L.; Nieman, J.K.C. Beneficial Reuse and Sustainability: The Fate of Organic Compounds in Land-Applied Waste. J. Environ. Qual. 2005, 34, 29–41. [CrossRef]
8. Adrover, M.; Farrús, E.; Moyà, G.; Vadell, J. Chemical properties and biological activity in soils of Mallorca following twenty years of treated wastewater irrigation. J. Environ. Manag. 2012, 95, S188–S192. [CrossRef]
9. Alguacil, M.d.M.; Torrecillas, E.; Torres, P.; García-Orenes, F.; Roldán, A. Long-Term Effects of Irrigation with Waste Water on Soil AM Fungi Diversity and Microbial Activities: The Implications for Agro-Ecosystem Resilience. PLoS ONE 2012, 7, e47680. [CrossRef]
10. Bedbabis, S.; Trigui, D.; Ben Ahmed, C.; Clodoveo, M.L.; Camposeo, S.; Vivaldi, G.A.; Ben Rouina, B. Long-terms effects of irrigation with treated municipal wastewater on soil, yield and olive oil quality. Agric. Water Manag. 2015, 160, 14–21. [CrossRef]
11. Dimitriou, I.; Aronsson, P. Wastewater and sewage sludge application to willows and poplars grown in lysimeters–Plant response and treatment efficiency. Biomass Bioenergy 2011, 35, 161–170. [CrossRef]
12. Magesan, G.N.; McLay, C.D.A.; Lal, V.V. Nitrate leaching from a free-draining volcanic soil irrigated with municipal sewage effluent in New Zealand. Agric. Ecosyst. Environ. 1998, 70, 181–187. [CrossRef]
13. Mohammad Rusan, M.J.; Hinnawi, S.; Rousan, L. Long term effect of wastewater irrigation of forage crops on soil and plant quality parameters. Desalination 2007, 215, 143–152. [CrossRef]
14. Qian, Y.L.; Mecham, B. Long-Term Effects of Recycled Wastewater Irrigation on Soil Chemical Properties on Golf Course Fairways. Agron. J. 2005, 97, 717–721. [CrossRef]
15. Segal, E.; Dag, A.; Ben-Gal, A.; Zipori, I.; Erel, R.; Suryano, S.; Yermiyahu, U. Olive orchard irrigation with reclaimed wastewater: Agronomic and environmental considerations. Agric. Ecosyst. Environ. 2011, 140, 454–461. [CrossRef]
16. Zavadil, J. The effect of municipal wastewater irrigation on the yield and quality of vegetables and crops. Soil Water Res. 2009, 4, 91–103. [CrossRef]
17. Asgari, K.; Cornelis, W.M. Heavy metal accumulation in soils and grains, and health risks associated with use of treated municipal wastewater in subsurface drip irrigation. Environ. Monit. Assess. 2015, 187, 410. [CrossRef]
18. Angin, I.; Yaganoglu, A.V.; Turan, M. Effects of Long-Term Wastewater Irrigation on Soil Properties. J. Sustain. Agric. 2005, 26, 31–42. [CrossRef]
19. Assouline, S.; Narkis, K. Effects of long-term irrigation with treated wastewater on the hydraulic properties of a clayey soil. Water Resour. Res. 2011, 47, W08530. [CrossRef]
20. Bedbabis, S.; Ben Rouina, B.; Boukhris, M.; Ferrara, G. Effect of irrigation with treated wastewater on soil chemical properties and infiltration rate. J. Environ. Manag. 2014, 133, 45–50. [CrossRef]
21. Lal, K.; Minhas, P.S.; Yadav, R.K. Long-term impact of wastewater irrigation and nutrient rates II. Nutrient balance, nitrate leaching and soil properties under peri-urban cropping systems. Agric. Water Manag. 2015, 156, 110–117. [CrossRef]
22. Abrol, I.P.; Yadav, J.S.P.; Massoud, F.I. Salt-Affected Soils and Their Management; FAO Soils Bulletin; Food and Agriculture Organization of the United Nations, Ed.; FAO: Rome, Italy, 1988; Volume 39.
23. Esperschuetz, J.; Anderson, C.; Bulman, S.; Katamian, O.; Horswell, J.; Dickinson, N.; Robinson, B. Response of Leptospermum scoparium, Kunzea robusta and Pinus radiata to contrasting biowastes. Sci. Total Environ. 2017, 587–588, 258–265. [CrossRef] [PubMed]
24. Halford, S.; Gutiérrez-Ginés, M.J.; Rees, A.; Alderton, I.; Schaller, K.; Smith, R.; Horswell, J. Effect of manuka (Leptospermum¯ scoparium) on nitrogen and Escherichia coli reductions in soils: A field experiment. Plant Soil 2021, 465, 491–502. [CrossRef]
25. Meister, A.; Li, F.; Gutierrez-Gines, M.J.; Dickinson, N.; Gaw, S.; Bourke, M.; Robinson, B. Interactions of treated municipal wastewater with native plant species. Ecol. Eng. 2022, 183, 106741. [CrossRef]
26. Davies, G.M.; Gray, A. Don’t let spurious accusations of pseudoreplication limit our ability to learn from natural experiments (and other messy kinds of ecological monitoring). Ecol. Evol. 2015, 5, 5295–5304. [CrossRef]
27. Landcare Research. New Zealand Soil Classifiation. Available online: https://soils-maps.landcareresearch.co.nz/#maps (accessed on 1 September 2023).
28. Blakemore, L.C.; Searle, P.L.; Daly, B.K. Methods for chemical analysis of soils. In NZ Soil Bureau Scientific Report 80; Dept. Scientific and Industrial Research: Lower Hutt, New Zealand, 1987.
29. Saunders, W.M.H. Phosphate retention by New Zealand soils and its relationship to free sesquioxides, organic matter, and other soil properties. N. Z. J. Agric. Res. 1965, 8, 30–57. [CrossRef]
30. New Zealand Government. Water Services (Drinking Water Standards for New Zealand) Regulations 2022; New Zealand Government: Wellington, New Zealand, 2022.
31. Ayers, R.S.; Westcot, D.W. Water Quality for Agriculture; FAO Irrigation and Drainage Paper; Food and Agriculture Organization of the United Nations: Rome, Italy, 1985; Volume 29.
32. R Core Team. R: A Language and Environment for Statistical Computing; R Foundation for Statistical Computing: Vienna, Austria, 2021.
33. Mendiburu, F.d.; Yaseen, M.; Agricolae: Statistical Procedures for Agricultural Research. R Package Version 1.4.0. 2020. Available online: https://cran.r-project.org/web/packages/agricolae/index.html (accessed on 1 September 2023).
34. Wickham, H. ggplot2: Elegant Graphics for Data Analysis; Springer: New York, NY, USA, 2016.
35. Meyer, F.; Perrier, V.; Carroll, I.; Dang, X.; Bevacqua, N.; Choi, D.Y.; Rocha, Z. Package ‘Esquisse’ Explore and Visualize Your Data Interactively. R Package Version 1.1.0. 2022. Available online: https://github.com/dreamRs/esquisse/ (accessed on 1 September 2023).
36. Garnier, S.; Ross, N.; Rudis, B.; Sciaini, M.; Camargo, A.P.; Scherer, C. Colorblind-Friendly Color Maps for R. 2023. Available online: https://sjmgarnier.github.io/viridis/ (accessed on 1 September 2023).
37. Lizarralde, C.A.; McDowell, R.; Condron, L.; Brown, J. The potential for phosphorus loss to groundwater from soils irrigated with dairy factory wastewater. N. Z. J. Agric. Res. 2023, 66, 189–207. [CrossRef]
38. Sparling, G.; Lilburne, L.; Vojvodi´c-Vukovi´c, M. Provisional Targets for Soil Quality Indicators in New Zealand; Landcare Research Science Series No. 34; Manaaki Whenua Press: Lincoln, New Zealand, 2008.
39. Gutierrez-Gines, M.J.; Mishra, M.; McIntyre, C.; Chau, H.W.; Esperschuetz, J.; McLenaghen, R.; Bourke, M.P.; Robinson, B.H. Risks and benefits of pasture irrigation using treated municipal effluent : A lysimeter case study, Canterbury, New Zealand. Environ. Sci. Pollut. Res. 2020, 27, 11830–11841. [CrossRef]
40. Hu, C.; Zhang, T.C.; Huang, Y.H.; Dahab, M.F.; Surampalli, R. Effects of Long-Term Wastewater Application on Chemical Properties and Phosphorus Adsorption Capacity in Soils of a Wastewater Land Treatment System. Environ. Sci. Technol. 2005, 39, 7240–7245. [CrossRef]
41. Xu, J.; Wu, L.; Chang, A.C.; Zhang, Y. Impact of long-term reclaimed wastewater irrigation on agricultural soils: A preliminary assessment. J. Hazard. Mater. 2010, 183, 780–786. [CrossRef]
42. Liu, Y.Y.; Haynes, R.J. Influence of land application of dairy factory effluent on soil nutrient status and the size, activity, composition and catabolic capability of the soil microbial community. Appl. Soil Ecol. 2011, 48, 133–141. [CrossRef]
43. Ndour, N.Y.B.; Baudoin, E.; Guissé, A.; Seck, M.; Khouma, M.; Brauman, A. Impact of irrigation water quality on soil nitrifying and total bacterial communities. Biol. Fertil. Soils 2008, 44, 797–803. [CrossRef]
44. Lal, K.; Minhas, P.S.; Yadav, R.K.; Rosin, K.G. GHG mitigation from sewage effluents: C sequestration after reuse in different urban cropping systems. Carbon Manag. 2020, 11, 281–290. [CrossRef]
45. Somenahally, A.C.; McLawrence, J.; Chaganti, V.N.; Ganjegunte, G.K.; Obayomi, O.; Brady, J.A. Response of soil microbial Communities, inorganic and organic soil carbon pools in arid saline soils to alternative land use practices. Ecol. Indic. 2023, 150, 110227. [CrossRef]
46. Cameron, K.C.; Di, H.J.; Moir, J.L. Nitrogen losses from the soil/plant system: A review. Ann. Appl. Biol. 2013, 162, 145–173. [CrossRef] 47. Gelsomino, A.; Badalucco, L.; Ambrosoli, R.; Crecchio, C.; Puglisi, E.; Meli, S.M. Changes in chemical and biological soil properties as induced by anthropogenic disturbance: A case study of an agricultural soil under recurrent flooding by wastewaters. Soil Biol. Biochem. 2006, 38, 2069–2080. [CrossRef]
48. de Lange, P.J. A revision of the New Zealand Kunzeaericoides (Myrtaceae) complex. PhytoKeys 2014, 40, 1–185. [CrossRef] [PubMed]
49. MWLR. S-Map Online. 2023. Available online: https://smap.landcareresearch.co.nz/ (accessed on 1 September 2023).
50. Baldi, M.; Burgess, S.; Mullan, B.; Salinger, J.; Ramsay, D.; Bell, R. Updated Climate Change Scenarios for the Kapiti Coast; NIWA: Wellington, New Zealand, 2007; p. 56.
51. Rowe, L.; Jackson, R.B.; Fahey, B. Land Use and Water Resources: Hydrological Effects of Different Vegetation Covers; SMF2167: Report No 5.; Landcare Research: Lincoln, New Zealand, 2002; p. 142.
52. Gutierrez-Gines, M.J.; Bishit, A.; Meister, A.; Robinson, B.H.; Clarke, D.; Tupuhi, G.; Alderton, I.; Horswell, J.; Wang, K.I.K.; Bohm, K.; et al. Maanuka Dominated Ecosystems to Improve Water and Soil Quality in Lake Waikare Catchment; ESR: Christchurch, New Zealand, 2022; Available online: https://waikatoriver.org.nz/wp-content/uploads/2022/06/WRA16-008-Final-Report- WRA-2022_10.pdf (accessed on 1 September 2023).
53. Hart, M.R.; Quin, B.F.; Nguyen, M.L. Phosphorus Runoff from Agricultural Land and Direct Fertilizer Effects: A Review. J. Environ. Qual. 2004, 33, 1954–1972. [CrossRef] [PubMed]
54. Gwenzi, W.; Munondo, R. Long-term impacts of pasture irrigation with treated sewage effluent on shallow groundwater quality. Water Sci. Technol. 2008, 58, 2443–2452. [CrossRef] [PubMed]
55. Kimberley, M.O.; Bergin, D.; Beets, P. Carbon Sequestration by Planted Native Trees and Shrubs. In Technical Handbook Section 10: Native Tree Plantations; Tane’s Tree Trust: Hamilton, New Zealand, 2014; Volume 10, pp. 1–12.
56. Piaszczyk, W.; Bło´nska, E.; Lasota, J.; Lukac, M. A comparison of C:N:P stoichiometry in soil and deadwood at an advanced decomposition stage. CATENA 2019, 179, 1–5. [CrossRef]
57. Tang, Z.; Xu, W.; Zhou, G.; Bai, Y.; Li, J.; Tang, X.; Chen, D.; Liu, Q.; Ma, W.; Xiong, G.; et al. Patterns of plant carbon, nitrogen, and phosphorus concentration in relation to productivity in China’s terrestrial ecosystems. Proc. Natl. Acad. Sci. USA 2018, 115, 4033–4038. [CrossRef]
58. Will, G.M. Increased Phosphorus Uptake by Radiata Pine in Riverhead Forest following Superphosphate Applications. N. Z. J. For. 1965, 10, 33–42.
59. Pan, B.; Xia, L.; Lam, S.K.; Wang, E.; Zhang, Y.; Mosier, A.; Chen, D. A global synthesis of soil denitrification: Driving factors and mitigation strategies. Agric. Ecosyst. Environ. 2022, 327, 107850. [CrossRef]
60. Scheer, C.; Fuchs, K.; Pelster, D.E.; Butterbach-Bahl, K. Estimating global terrestrial denitrification from measured N2O:(N2O + N2) product ratios. Curr. Opin. Environ. Sustain. 2020, 47, 72–80. [CrossRef]
61. Sánchez–González, A.; Chapela–Lara, M.; Germán–Venegas, E.; Fuentes-García, R.; Río-Portilla, F.d.; Siebe, C. Changes in quality and quantity of soil organic matter stocks resulting from wastewater irrigation in formerly forested land. Geoderma 2017, 306, 99–107. [CrossRef]
62. Oliver, G.R.; Beets, P.N.; Garrett, L.G.; Pearce, S.H.; Kimberly, M.O.; Ford-Robertson, J.B.; Robertson, K.A. Variation in soil carbon in pine plantations and implications for monitoring soil carbon stocks in relation to land-use change and forest site management in New Zealand. For. Ecol. Manag. 2004, 203, 283–295. [CrossRef]
Disclaimer/Publisher’s Note: The statements, opinions and data contained in all publications are solely those of the individual author(s) and contributor(s) and not of MDPI and/or the editor(s). MDPI and/or the editor(s) disclaim responsibility for any injury to people or property resulting from any ideas, methods, instructions or products referred to in the content.