R E S E A R C H A R T I C L E
Hadee Thompson- Morrison1,2 | Elena Moltchanova3 | Sally Gaw1 | Brett Robinson1
1School of Physical and Chemical Sciences, University of Canterbury, Christchurch, New Zealand
2Current address: Manaaki Whenua Landcare Research, Lincoln, New Zealand
3School of Mathematics and Statistics, University of Canterbury, Christchurch, New Zealand
Correspondence
Hadee Thompson- Morrison, School of Physical and Chemical Sciences, University of Canterbury, Christchurch, New Zealand. Email: hadee.thompson-morrison@ protonmail.com
Funding information
The Centre for Integrated Biowaste Research funded by Strategic Science Investment Funding from Ministry of Business, Innovation and Employment, New Zealand (contract C03X1701)
1Abstract摘要
Trace elements (TEs) can reduce both the quantity and quality of agricultural produce when essential trace elements are deficient or when any trace element accumulates beyond threshold concentrations in soil. Therefore, TEs in agricultural systems should be managed to ensure that soil concentrations are kept within guideline levels and do not affect production. Oil palm agriculture in Indonesia occurs on weathered, acidic soils that require substantial fertilizer inputs to maintain production. To understand whether TE accumulation in soils resulting from fertilizer and pesticide use may affect production in the future, we have developed a mass- balance model to calculate likely concentrations of TEs in soils after given time periods under production conditions. Our model was developed to simulate processes which occur in the soil– plant system and involve the transport of TEs. It was developed to be rationally convenient, that is, parsimonious, working at environmentally relevant concentrations and able to be applied at the hectare scale to large agricultural systems. The model uses the mass- balance equation ∑evaporation, erosion, soil adsorption coefficient, initial plant and soil contami-d MY,d = ∑d M0,d + ∑y My+,∙ − ∑y �My(P) + My(L) + My(R)� and uses the critical parameters of rainfall, nant concentrations, as well as soil- and- crop specific parameters. We validated our model using a data set from a 64- year fertilizer trial, which had known inputs and application rates of fluorine (F), cadmium (Cd) and uranium (U). We applied the validated model to a smallholder oil palm plantation in Indonesia, modelling accumulation of copper (Cu), F, Cd and U under recommended production conditions, to determine which TEs might limit production and the likely timeframes for this. Our results indicate that topsoil concentrations of Cu and F were likely to reach phytotoxic concentrations in soils (289 and 719 mg kg−1, respectively), within 50 years under these conditions. The future feasibility of intensive oil palm production on weathered, low fertility soils such as those in Indonesia should be assessed to avoid long- term negative impacts on soil quality.
当必需微量元素缺乏或任何微量元素在土壤中的累积超过阈值浓度时,微量元素(TEs)均可降低农产品的产量和品质。因此,应对农业系统中的微量元素进行管理,以确保土壤中的浓度保持在指导值范围内,不影响生产。印度尼西亚的油棕种植位于风化的酸性土壤上,需要大量施肥才能维持生产。为了解施用化肥和农药引起的土壤微量元素累积是否会影响未来的生产,我们建立了一个质量平衡模型,用以计算在生产条件下经过给定时间后土壤中微量元素的可能浓度。该模型旨在模拟土壤–植物系统中涉及微量元素迁移的过程。模型的构建力求合理简便,即简约,适用于环境相关浓度,并可在公顷尺度上应用于大型农业系统。该模型采用质量平衡方程∑d MY,d = ∑d M0,d + ∑y My+,∙ − ∑y (My(P) + My(L) + My(R)),并使用降雨、蒸发、侵蚀、土壤吸附系数、植物和土壤初始污染物浓度等关键参数以及土壤和作物特定参数。我们利用一项为期64年的施肥试验数据集对模型进行了验证,该试验中氟(F)、镉(Cd)和铀(U)的输入量和施用量均为已知。我们将经过验证的模型应用于印度尼西亚的一个小农油棕种植园,模拟推荐生产条件下铜(Cu)、F、Cd和U的累积,以确定哪些微量元素可能限制生产及其可能的时间尺度。结果表明,在上述条件下,表层土壤中Cu和F的浓度可能在50年内达到植物毒性浓度(分别为289和719 mg kg−1)。应对在印度尼西亚等地风化、低肥力土壤上开展集约化油棕生产的未来可行性进行评估,以避免对土壤质量造成长期负面影响。
K E Y W O R D S mass- balance, model, oil palm, rhizosphere processes, trace elements
关键词 质量平衡,模型,油棕,根际过程,微量元素
This is an open access article under the terms of the Creative Commons Attribution-NonCommercial-NoDerivs License, which permits use and distribution in any medium, provided the original work is properly cited, the use is non-commercial and no modifications or adaptations are made.
本文为开放获取文章,依据知识共享署名–非商业性使用–禁止演绎许可协议(Creative Commons Attribution-NonCommercial-NoDerivs License)发布。该协议允许在任何媒介中使用和传播本文,前提是正确引用原作,用于非商业目的,且不作任何修改或改编。
© 2023 The Authors. Soil Use and Management published by John Wiley & Sons Ltd on behalf of British Society of Soil Science.
© 2023 作者。Soil Use and Management由John Wiley & Sons Ltd代表英国土壤科学学会(British Society of Soil Science)出版。
21 | INTRODUCTION1 | 引言
Most agricultural production requires applications of agrichemicals and amendments to promote crop growth and aid soil fertility. These include fertilizers, pesticides and organic amendments, such as composts. Many agrichemicals contain trace elements (TEs) as either active ingredients (e.g. copper (Cu) fungicides) or contaminants. Phosphatic fertilizers may contaminate soil with TEs because of the impurities, especially fluorine (F), cadmium (Cd) and uranium (U) that phosphate rock naturally contains (CSIRO, 2009; Loganathan et al., 2003; McGrath & Tunney, 2010; Taylor et al., 2016). Similarly, organic amendments such as sewage sludge, manures and composts may contain elevated levels of these and other TEs (Bolan et al., 2004; European Commission, 2004), while pesticides may contain TEs as active ingredients, particularly Cu, zinc (Zn) and manganese (Mn) (Gimeno- García et al., 1996; Rocha et al., 2014). Additionally, water used for irrigation may contain contaminants such as arsenic (As) and constitute a source of TEs to production soils (Bhatti et al., 2013).
大多数农业生产需要施用农用化学品和改良剂,以促进作物生长并提高土壤肥力。这些物质包括化肥、农药以及堆肥等有机改良剂。许多农用化学品含有微量元素(TEs),或作为有效成分(如铜(Cu)杀菌剂),或作为杂质。由于磷矿石天然含有杂质,尤其是氟(F)、镉(Cd)和铀(U),磷肥可能使土壤受到微量元素污染(CSIRO, 2009; Loganathan et al., 2003; McGrath & Tunney, 2010; Taylor et al., 2016)。同样,污水污泥、粪肥和堆肥等有机改良剂中这些微量元素及其他微量元素的含量也可能较高(Bolan et al., 2004; European Commission, 2004),而农药可能以微量元素作为有效成分,尤其是Cu、锌(Zn)和锰(Mn)(Gimeno- García et al., 1996; Rocha et al., 2014)。此外,灌溉用水可能含有砷(As)等污染物,从而成为生产性土壤中微量元素的来源之一(Bhatti et al., 2013)。
Agrichemical application rates and type vary by system: for example, in dairy farms, the predominant input is nitrogen (N) at recommended rates (for New Zealand pasture) of 25– 50 kg ha−1 year−1, while in horticultural systems, the dominant agrichemicals are pesticides containing TEs such as Cu at rates of ≤16 kg ha−1 year−1 (Bivi et al., 2016; Fungicide Resistance Action Committee, 2021; Morgan & Taylor, 2004; Schneider et al., 2019). Factors influencing application rates of agrichemicals and associated TEs include the intensity of the system as well as the crops grown (Liu et al., 2021; López- Alonso et al., 2012). In intensive oil palm systems, recommended rates of N, phosphorus (P) and potassium (K) are 218– 286, 143– 215 and 358– 429 kg ha−1, respectively (Woittiez et al., 2015). Varying rates of Cd are applied through P fertilizers because of varying native concentrations of Cd in phosphate rock: applications of 215 kg P could contain from 9.8 to 98 g Cd ha−1 (Oosterhuis et al., 2000).
农用化学品的施用量和类型因系统而异:例如,在奶牛场中,主要输入为氮(N),推荐施用量(针对新西兰牧场)为25– 50 kg ha−1 year−1;而在园艺系统中,主要的农用化学品是含Cu等微量元素的农药,施用量≤16 kg ha−1 year−1(Bivi et al., 2016; Fungicide Resistance Action Committee, 2021; Morgan & Taylor, 2004; Schneider et al., 2019)。影响农用化学品及其相关微量元素施用量的因素包括系统的集约化程度以及所种植的作物(Liu et al., 2021; López- Alonso et al., 2012)。在集约化油棕系统中,N、磷(P)和钾(K)的推荐施用量分别为218– 286、143– 215和358– 429 kg ha−1(Woittiez et al., 2015)。由于磷矿石中Cd的天然含量不同,通过磷肥施入的Cd量也各不相同:施用215 kg P可能带入9.8至98 g Cd ha−1(Oosterhuis et al., 2000)。
When TE- containing amendments are applied to soils and crops over prolonged periods, these TEs have potential to accumulate in soils of productive systems (Luo et al., 2009; Molina et al., 2009). Consequently, soil fertility may be affected if these TEs reach threshold levels (Obbard, 2001), and plant uptake of TEs may reach critical levels for plant growth and food safety (Asati et al., 2016; Tóth et al., 2016). Repeated applications of TE- containing agrichemicals to productive land may limit both the sustainability of productive systems and future land use (Mills et al., 2005). In France, repeated application of copper sulphate (CuSO4) fungicides has resulted in the accumulation of Cu in soils that now limit agricultural production (Besnard et al., 1999). As well as degrading soil fertility and quality, TE accumulation in soils may endanger human health through food- chain transfer (Chaney, 1989). The export of offal from animals in New Zealand is restricted owing to the risk of Cd accumulation in these animal products as a result of Cdcontamination of grazed pasture (Rys, 2011). Cadmium is highly plant- available in acidic soils and can pose foodchain transfer risks in concentrations <1 mg kg−1 (Elbana & Selim, 2010; Rys, 2011). Cadmium is primarily added to soils through phosphate fertilizer application, along with F and U (Taylor et al., 2016). Other TEs that may accumulate in soils as a result of agrichemical use include Zn, As and lead (Pb). Accumulation of F in soils may be detrimental as it can contribute to soil degradation via dealumination processes, whereby excess F in soil results in accelerated weathering of aluminosilicates and release of Al3+ into soil solution (Taylor & Kim, 2009). This produces unfavourable conditions for plant growth because of Al3+ toxicity (Taylor et al., 2012). In response to these risks, soil guideline values (SGVs) have been developed to set limits on TE concentrations in soils. Such SGVs have been set to protect a variety of values, including human health, soil quality, land- use flexibility and international trade (Cavanagh & Munir, 2016). Soil guideline values may be land use- and soil type- specific and differ for each TE: International SGVs for Cu and U in agricultural soils are 63 and 23 mg kg−1, respectively (Canadian Council of Ministers of the Environment, 2007), while in acidic soils, Cd has a SGV of 1 mg kg−1 (New Zealand Water & Wastes Association, 2003). Exceedance of agricultural SGVs may reduce yields and result in economic losses (Rys, 2011).
当含微量元素的改良剂长期施用于土壤和作物时,这些微量元素有可能在生产系统的土壤中累积(Luo et al., 2009; Molina et al., 2009)。因此,若这些微量元素达到阈值水平,土壤肥力可能受到影响(Obbard, 2001),植物对微量元素的吸收可能达到影响植物生长和食品安全的临界水平(Asati et al., 2016; Tóth et al., 2016)。在生产性土地上反复施用含微量元素的农用化学品,可能同时限制生产系统的可持续性和未来的土地利用(Mills et al., 2005)。在法国,反复施用硫酸铜(CuSO4)杀菌剂已导致土壤中Cu累积,目前已限制了农业生产(Besnard et al., 1999)。除降低土壤肥力和质量外,土壤中微量元素的累积还可能通过食物链传递危害人体健康(Chaney, 1989)。由于放牧草地受到Cd污染,新西兰动物内脏存在Cd累积风险,其出口因此受到限制(Rys, 2011)。在酸性土壤中,Cd的植物有效性很高,浓度<1 mg kg−1时即可能带来食物链传递风险(Elbana & Selim, 2010; Rys, 2011)。Cd主要通过施用磷肥与F和U一同进入土壤(Taylor et al., 2016)。其他可能因使用农用化学品而在土壤中累积的微量元素包括Zn、As和铅(Pb)。F在土壤中的累积可能有害,因为它可通过脱铝过程导致土壤退化,即土壤中过量的F加速铝硅酸盐的风化并使Al3+释放到土壤溶液中(Taylor & Kim, 2009)。由于Al3+的毒性,这会造成不利于植物生长的条件(Taylor et al., 2012)。针对这些风险,人们制定了土壤指导值(SGVs)以限制土壤中微量元素的浓度。制定此类土壤指导值旨在保护多种价值,包括人体健康、土壤质量、土地利用灵活性和国际贸易(Cavanagh & Munir, 2016)。土壤指导值可能因土地利用方式和土壤类型而异,且各微量元素的指导值不同:农业土壤中Cu和U的国际土壤指导值分别为63和23 mg kg−1(Canadian Council of Ministers of the Environment, 2007),而在酸性土壤中,Cd的土壤指导值为1 mg kg−1(New Zealand Water & Wastes Association, 2003)。超过农业土壤指导值可能导致减产和经济损失(Rys, 2011)。
Land converted to oil palm plantations from tropical forest in Southeast Asia often has low fertility and requires high fertilizer inputs, particularly P and K, to support production (Corley & Tinker, 2015; Woittiez et al., 2015). High applications of P fertilizers are associated with an increased soil Cd burden (Roberts, 2014). Pesticides, including Cubased fungicides, are recommended to control plant pests common in oil palm production including Ganoderma spp. (Bivi et al., 2016). In contrast to traditional oil palm growing systems in parts of Africa (Corley & Tinker, 2015), oil palm production in Southeast Asia has undergone significant expansion since 1989 (Vijay et al., 2016) and most active plantations can be considered new systems that are naïve to fertilizer use. Soils from Indonesian oil palm growing regions are deficient in N, P and K, likely because of insufficient fertilizer application (Thompson- Morrison et al., 2022a; Woittiez et al., 2015). Oil palm agriculture and fertilizers are subsidized in Indonesia, and resultingly, fertilizer applications are often limited to subsidized products (Kissinger, 2016; Woittiez et al., 2018). This has led to low levels of key nutrients that are not available in subsidized forms, such as K, in Indonesian soils (Thompson- Morrison et al., 2022a;
东南亚由热带森林转变而来的油棕种植园土地通常肥力较低,需要大量施肥,尤其是P和K,才能维持生产(Corley & Tinker, 2015; Woittiez et al., 2015)。大量施用磷肥与土壤Cd负荷增加有关(Roberts, 2014)。推荐使用包括铜基杀菌剂在内的农药来防治油棕生产中常见的植物病虫害,如Ganoderma spp.(Bivi et al., 2016)。与非洲部分地区的传统油棕种植系统不同(Corley & Tinker, 2015),东南亚的油棕生产自1989年以来大幅扩张(Vijay et al., 2016),大多数现有种植园可视为此前未施用过化肥的新系统。印度尼西亚油棕种植区的土壤缺乏N、P和K,这可能是施肥不足所致(Thompson- Morrison et al., 2022a; Woittiez et al., 2015)。印度尼西亚对油棕种植和化肥实行补贴,因此施肥往往仅限于受补贴的产品(Kissinger, 2016; Woittiez et al., 2018)。这导致印度尼西亚土壤中K等无补贴形式的关键养分含量较低(Thompson- Morrison et al., 2022a;
Woittiez et al., 2015). Soils analysed by Thompson- Morrison et al. (2022a) from active and abandoned oil palm plantations in Indonesia displayed characteristics typical of soils with limited fertilizer histories, including P associated with mineral soil phases and concentrations of most TEs at or below background levels. However, accumulation of some TEs including Cu, Zn, As and Pb was noted and attributed to agrichemical use. There is potential that increased fertilizer application in oil palm systems that raised soil nutrient levels to enable viable production would also result in the accumulation of TEs in these soils at concentrations that would eventually become phytotoxic (Thompson- Morrison et al., 2022a). Soils from older oil palm systems in Africa have been reported to have high TE concentrations (Olafisoye et al., 2020) and it is perceivable that the same may eventually occur in Southeast Asia.
Woittiez et al., 2015)。Thompson- Morrison et al. (2022a)分析了印度尼西亚现有及废弃油棕种植园的土壤,发现其呈现施肥历史有限的土壤的典型特征,包括P与土壤矿物相结合,以及大多数微量元素浓度处于或低于背景水平。然而,也发现Cu、Zn、As和Pb等部分微量元素出现累积,并将其归因于农用化学品的使用。为使油棕系统实现可行生产而增加施肥以提高土壤养分水平,也可能导致这些土壤中微量元素累积,并最终达到植物毒性浓度(Thompson- Morrison et al., 2022a)。已有报道指出,非洲较老油棕系统的土壤中微量元素浓度较高(Olafisoye et al., 2020),可以预见东南亚最终也可能出现同样的情况。
Current agricultural systems are leading to TE accumulation and in some cases, this is unsustainable: the soil will either become infertile or crops will come to contain unacceptable TE concentrations. The likely timeframes to reach this endpoint can inform sustainable application rates (Mills et al., 2005). Mass- balance models can calculate future soil TE concentrations under specified conditions. Mass balances entail the matching of inputs into a system with outputs from that system and are able to simulate relevant processes in order to calculate likely future scenarios (Wania & Mackay, 1999).
当前的农业系统正导致微量元素累积,在某些情况下这是不可持续的:土壤要么变得贫瘠,要么作物中微量元素浓度达到不可接受的水平。达到这一终点的可能时间尺度可为确定可持续施用量提供依据(Mills et al., 2005)。质量平衡模型可以计算特定条件下未来土壤中微量元素的浓度。质量平衡是指将系统的输入与系统的输出相匹配,并能够模拟相关过程,从而计算未来可能出现的情景(Wania & Mackay, 1999)。
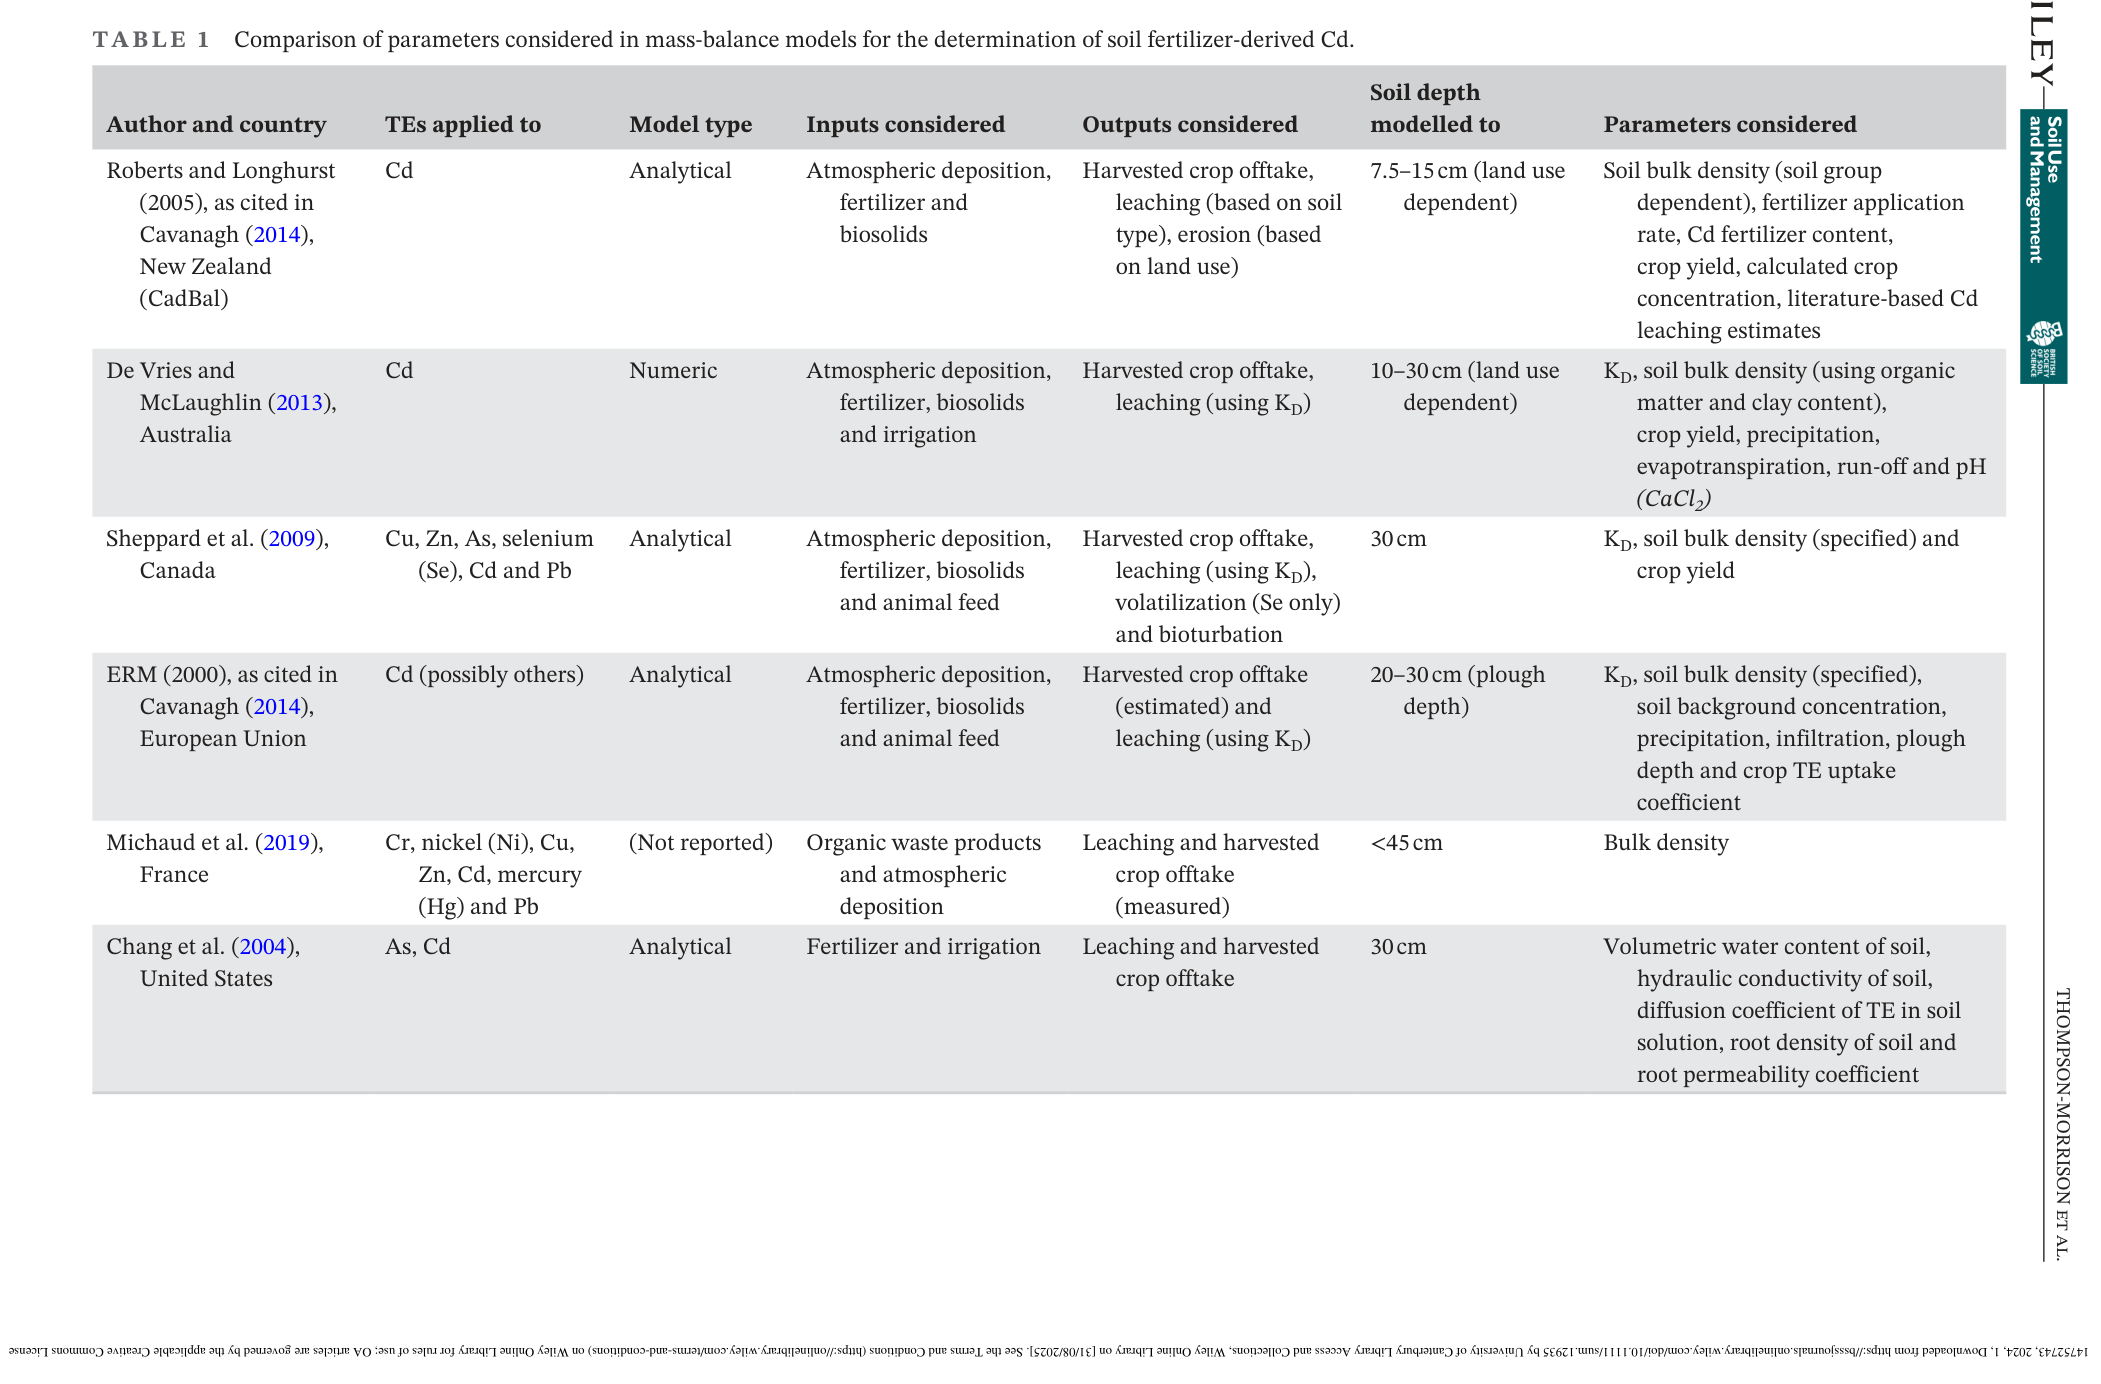
Several mass- balance models specific to the determination of agriculturally derived soil TEs have been developed in New Zealand (Roberts & Longhurst, 2005, as cited in Cavanagh, 2014), Australia (De Vries & McLaughlin, 2013), Canada (Sheppard et al., 2009), the European Union (ERM, 2000, as cited in Cavanagh, 2014), France (Michaud et al., 2019) and the United States (Chang et al., 2004) (Table 1). Of the models identified here, two are inaccessible (those described by Roberts and Longhurst (2005) and ERM (2000), as cited in Cavanagh, 2014) and as such, knowledge of their details is limited to secondary sources. The New Zealand model to assess Cd accumulation is available for public use, however, the model itself remains unpublished. Some of the parameters used in this model are country- specific in that they depend on the selection of a New Zealand soil type which specifies the parameter. All the models excluding the one described by De Vries and McLaughlin (2013) are analytical in that they are able to be calculated by hand with given inputs.
新西兰(Roberts & Longhurst, 2005, as cited in Cavanagh, 2014)、澳大利亚(De Vries & McLaughlin, 2013)、加拿大(Sheppard et al., 2009)、欧盟(ERM, 2000, as cited in Cavanagh, 2014)、法国(Michaud et al., 2019)和美国(Chang et al., 2004)已建立了若干专门用于确定农业来源土壤微量元素的质量平衡模型(表1)。在此列出的模型中,有两个无法获取(即Roberts and Longhurst (2005)和ERM (2000)所描述的模型,as cited in Cavanagh, 2014),因此对其细节的了解仅限于二手资料。新西兰用于评估Cd累积的模型可供公众使用,但模型本身尚未发表。该模型中使用的部分参数具有国家特异性,因为其取决于所选的新西兰土壤类型,由土壤类型确定参数值。除De Vries and McLaughlin (2013)所描述的模型外,其余模型均为解析模型,即在给定输入的情况下可以手工计算。
For the purposes of modelling TE fluxes in oil palm agroecosystems, we wanted a model that incorporates processes that occur in the soil plant system, specifically, the dynamic redistribution of TEs in soil resulting from plant uptake and the downward percolation of water. This necessitated a numerical rather than an analytical model. We wanted to be able to model a range of TEs including
为模拟油棕农业生态系统中的微量元素通量,我们需要一个能够纳入土壤–植物系统中所发生过程的模型,特别是由植物吸收和水分向下渗滤所引起的土壤中微量元素的动态再分布。这就需要采用数值模型而非解析模型。我们希望能够模拟多种微量元素,包括
F, Cu, Cd and U to determine which TEs might limit production and under what timeframes. We also needed to be able to tailor model parameters to tropical soils, and therefore, the model had to be generally applicable rather than country- specific. We sought to model the primary processes that occur in agricultural systems and to determine the fate and movement of TEs in the soil– plant system. None of the models detailed in Table 1 were sufficient for our purposes or had been validated. Our desired model should also be easily parameterized and able to be applied to environmentally relevant concentrations of TEs in agricultural systems. The model should be able to be applied regardless of location or soil type, at the hectare scale for large- scale agricultural land. The objectives of this study were therefore to develop a whole- system model that met these requirements; to validate the model using data from long- term agricultural trials with known sources and rates of TE inputs to soils over time; and to use the model to calculate the TE concentrations likely to occur under oil palm production in Southeast Asian soils in order to understand likely timeframes and limiting TEs of any accumulation.
F、Cu、Cd和U,以确定哪些微量元素可能限制生产以及在何种时间尺度上限制生产。我们还需要能够针对热带土壤调整模型参数,因此模型必须具有普遍适用性,而非针对特定国家。我们力求模拟农业系统中发生的主要过程,并确定微量元素在土壤–植物系统中的归趋和迁移。表1中列出的模型均不能满足我们的需求,也均未经过验证。我们所需的模型还应易于参数化,并能适用于农业系统中环境相关浓度的微量元素。无论地点或土壤类型如何,该模型均应能够在公顷尺度上应用于大面积农业用地。因此,本研究的目的是:建立一个满足上述要求的全系统模型;利用微量元素来源和输入速率已知的长期农业试验数据对模型进行验证;并利用该模型计算东南亚土壤在油棕生产条件下可能出现的微量元素浓度,以了解任何累积的可能时间尺度及限制性微量元素。
32 | METHODS2 | 方法
2.1 | Model development2.1 | 模型构建
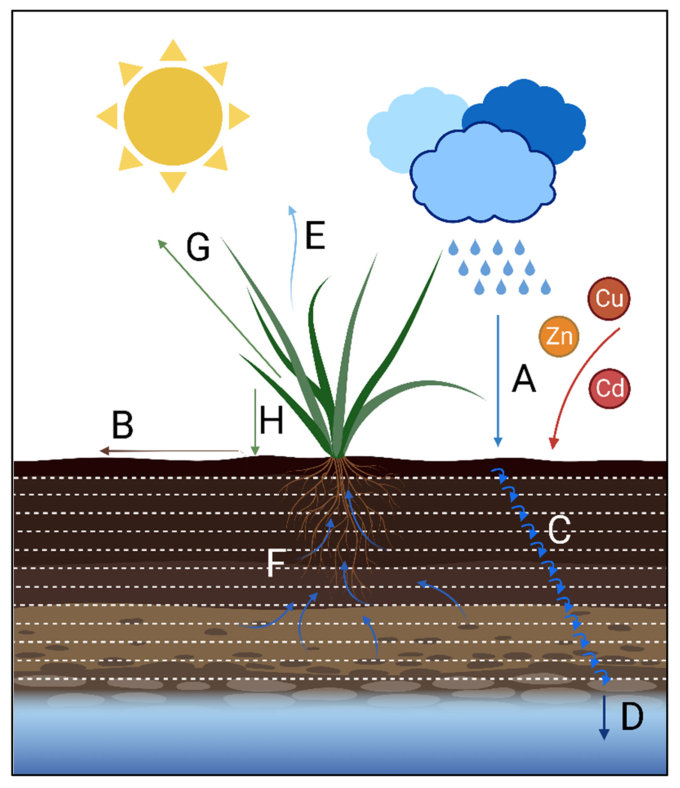
Our modelling approach entails the simulation of the fluxes of TEs in the soil– plant system using lumped parameters. The primary processes considered here are inputs of water and contaminant to soil; incorporation of applied contaminant (e.g. by ploughing) and downward movement of water and contaminants through soil; leaching of water and contaminant to groundwater; uptake of water and contaminant by plant roots; evapotranspiration which drives the uptake of water from soil by plant roots; offtake of biomass containing contaminant from the site; return and reincorporation of biomass containing contaminant to soil; and soil and contaminant removal through erosion (Figure 1). The model takes a total of 17 input parameters specified by the user, divided into general, soil, plant and contaminant categories (Table 2). These processes are treated as onedimensional, that is, they do not incorporate lateral movement of water or TEs. The hectare scale equivalent is used in the model, and therefore, it may be applied to any area.
我们的建模方法采用集总参数模拟土壤–植物系统中的微量元素通量。本文考虑的主要过程包括:水和污染物向土壤的输入;施入污染物的混入(如通过翻耕)以及水和污染物在土壤中的向下迁移;水和污染物向地下水的淋溶;植物根系对水和污染物的吸收;驱动植物根系从土壤中吸收水分的蒸散作用;含污染物生物量从场地的移出;含污染物生物量返还并重新混入土壤;以及土壤和污染物因侵蚀而流失(图1)。该模型共需用户指定17个输入参数,分为一般参数、土壤参数、植物参数和污染物参数四类(表2)。这些过程均按一维处理,即不考虑水或微量元素的横向迁移。模型采用公顷尺度当量,因此可应用于任何面积。
We wanted the model to be simple, rationally convenient and able to work with biologically relevant concentrations. The model can be envisioned as a tipping bucket which means that it has to be implemented via numerical iterations rather than analytically. The model monitors the dynamics of soil properties over time by explicitly modelling a number of processes, including those described in Figure 1 over time at different depths. Below, we describe the modelling process step by step. The full model code can be found in Appendix S1.
我们希望模型简单、合理简便,并能处理生物相关浓度。该模型可设想为一个翻斗,这意味着必须通过数值迭代而非解析方法来实现。模型通过显式模拟多个过程(包括图1中所述的过程)在不同深度随时间的变化,来监测土壤性质随时间的动态。下面我们逐步描述建模过程。完整的模型代码见附录S1。
2.2 | Model processes2.2 | 模型过程

In what follows, we divide the soil into D 1 cm layers. Let My,d describe the TE mass (g) in year y = 1, … , Y in layer d = 1, … , D with d = 1 corresponding to the topmost layer. The model is then initialized as follows.
以下将土壤划分为D个1 cm土层。设My,d为第y年(y = 1, … , Y)第d层(d = 1, … , D)中的微量元素质量(g),其中d = 1对应最上层。模型按如下方式初始化。
Given soil bulk density 훾, we evaluate soil mass at depth d as and the initial TE mass at depth d as
给定土壤容重훾,深度d处的土壤质量计算为 深度d处的初始微量元素质量计算为


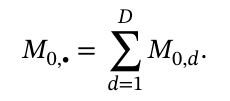
where C0 is the initial TE concentration in soil. The first mass- balance variable, the mass of contaminant initially in the soil is then
式中,C0为土壤中微量元素的初始浓度。第一个质量平衡变量,即土壤中污染物的初始质量为

2.2.2 | Incorporation2.2.2 | 混入
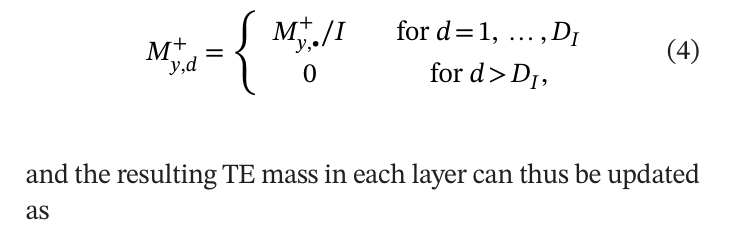
Let My+,∙ be the total contaminant mass (g) added to the soil in year y down to incorporation depth DI. The addition to each layer of the soil can then be evaluated as
设My+,∙为第y年添加到土壤中至混入深度DI的污染物总质量(g)。则各土层的添加量可计算为
My,d = My−1,d + My+,d.
My,d = My−1,d + My+,d.

In the current model, we assume the amount of added contaminant to be constant over the years, that is, My+,∙ = 햼허헇헌헍ant. Maintenance phosphate applications, for example, are typically consistent over time (Mokany et al., 2010). Similarly, spraying applications are prescribed on an annual basis (MPOB, 2015).
在当前模型中,我们假定各年添加的污染物量恒定,即My+,∙ = 常数。例如,维持性磷肥施用量通常随时间保持稳定(Mokany et al., 2010)。同样,喷施作业也按年度规定(MPOB, 2015)。
2.2.3 | Soil loss2.2.3 | 土壤流失
The first mechanism considered in the model after the initial application of TEs is the loss of TEs from soil through run- off. This applies only to the topmost soil layer (d = 1). Given the annual erosive loss mass E (assumed constant in time), the fraction of TE mass lost because of run- off in the top layer is evaluated as
在初次施入微量元素后,模型考虑的第一个机制是微量元素通过径流从土壤中流失。该过程仅适用于最上层土壤(d = 1)。给定年侵蚀流失质量E(假定不随时间变化),表层中因径流而流失的微量元素质量比例计算为

The TE mass in the top layer is then updated as
表层中的微量元素质量随后更新为

| Notation符号 | Code ID代码ID | Parameters参数 | Unit单位 | Notes备注 |
|---|---|---|---|---|
| General pa | rameters | |||
| y | iTime | Simulation time | year | |
| D | iSimulationDepth | Simulation depth | cm | Must be≥root depth |
| T | iRainfall | Rainfall and irrigation | mm year−1 | Rainfall infiltrates soil and is taken up by plants down to root depth |
| V | iET | Evapotranspiration | mm year−1 | This is taken up evenly by plants down to the root depth (assumes uniform root distribution) |
| Soil param | eters | |||
| C0 | iInitialSoilCon | Initial contaminant concentration | mg kg−1 | Must be>0 |
| E | iSoilLoss | Erosive loss | t ha−1year−1 (equiv) | Mass of soil lost to erosion and run- off |
| K | iKdSoil | KD | Soil adsorption coefficient specific to contaminant | |
| 훾 | iSoilDensity | Bulk density | t m3 – 1 | |
| W | iSliceWaterMass | Porosity | % | Equates to the mass of water (t ha−1) that a 1 cm layer of soil can hold |
| Plant para | meters | |||
| [NA] | iDryBiomassProduced | Dry biomass produced | t ha−1 | Mass of removeable crop produced at the site |
| B | iPercentRemoved | Biomass removed from site | % | Harvested crop as a proportion of total removeable crop produced |
| DR | iRootDepth | Root depth | cm | Must be≤simulation depth. Roots are considered to have a uniform density. |
| i | iInitialCropCon | Initial contaminant concentration | mg kg−1 | Must be>0 |
| N | iK | Decay constant | 0≤K<0.5 | |
| Contamina | nt parameters | |||
| M | iConApplied | Mass applied | g ha−1year−1 | Mass of contaminant applied in amendments, irrigation water etc |
| [NA] | iAtmosDeposition | Atmospheric deposition | g ha−1year−1 | Added to mass applied to give total contaminant added |
| DI | iIncorporationDepth | Incorporation depth | cm | The depth to which the contaminant is incorporated into the soil |
The annual run- off soil loss is thus因此,年径流土壤流失量为

2.2.4 | Drainage and leaching2.2.4 | 排水与淋溶
The percolation of water and TEs downwards through the soil profile is simulated using the drainage and leaching function. This function uses the inputs of rainfall and irrigation (T), evapotranspiration (V) and porosity (W). All of these are assumed to be constant in the current model, as it uses average annual rates. The model does not include extreme climatic events and will be less accurate in climates where there is large annual variation in rainfall. For historical applications of the model, past climatic data that offers higher accuracy than average annual rates may be useful. Drainage and leaching are calculated on a yearly timestep. The soil profile is divided into 1 cm slices and where the water content in a single slice reaches above saturation, soil solution is transported to the underlying layer. Water leached from the bottom layer is assumed to be drainage. The mass of water moving through the soil profile (Tm) is described by the simple subtraction of water removed through evapotranspiration from the total water inputs as
水和微量元素通过土壤剖面的向下渗滤采用排水与淋溶函数进行模拟。该函数使用降雨和灌溉量(T)、蒸散量(V)和孔隙度(W)作为输入。由于当前模型采用年平均速率,这些参数均假定为常数。模型不包括极端气候事件,因此在降雨年际变化较大的气候条件下精度会降低。对于模型的历史应用,采用比年平均速率精度更高的历史气候数据可能会有所帮助。排水与淋溶以年为时间步长进行计算。土壤剖面被划分为1 cm的薄层,当单一薄层的含水量超过饱和时,土壤溶液被输送至下一层。从最底层淋出的水分视为排水。通过土壤剖面移动的水量(Tm)由总输水量简单减去蒸散所移除的水量来描述:

The residual precipitation is multiplied by 10 to translate mm into cm. The model then determines the number of iterations (or loops) L to run Tm through each layer of soil as where ⌊⌋ denote downward truncation to ensure that L is an integer.
将剩余降水量乘以10,以将mm换算为cm。随后,模型确定使Tm通过每一土层的迭代(或循环)次数L,式中⌊⌋表示向下取整,以确保L为整数。

During each loop, l = 1, … , L, at each layer of soil down to the specified simulation depth d, the TE mass in soil is mobilized by the downward movement of water and is thus removed from that soil layer d and added to the next one d + 1:
在每次循环l = 1, … , L中,对于直至指定模拟深度的每一土层d,土壤中的微量元素质量随水分向下移动而被活化,因而从该土层d中移出并加入下一土层d + 1:
My,d = My,d − My(s,d) for d = 1, … , D (11) and My,d+1 = My,d+1 + My(s,d) for d = 1, … , D, (12) where My(s,d) is the solution mass evaluated as My,d ∕Sd My(s,d) = K W. (13)
My,d = My,d − My(s,d),其中d = 1, … , D (11) 以及 My,d+1 = My,d+1 + My(s,d),其中d = 1, … , D,(12) 式中,My(s,d)为溶液中的质量,计算式为 My,d ∕Sd My(s,d) = K W。(13)
The annual leached mass My(L) is then the sum of all the My(s,D) over all the loops. Note, that water and contaminant continue to move downwards beyond the soil profile (the outflow boundary condition).
年淋溶质量My(L)即为所有循环中全部 My(s,D)之和。需要注意的是,水和污染物会继续向下移动至土壤剖面以下(出流边界条件)。
where ø(H) is the root absorption factor at soil solution concentration H (mg L−1) and ø1 is the measured root absorption factor at soil solution concentration H1.N represents the decay constant (0 ≤N < 0.5).
式中,ø(H)为土壤溶液浓度H(mg L−1)下的根系吸收因子,ø1为土壤溶液浓度H1下实测的根系吸收因子。N表示衰减常数(0 ≤N < 0.5)。
Assuming, that roots grow to depth DR and are evenly distributed through layers d = 1, … , DR, the contaminant mass removed from a layer of soil through plant uptake can then be evaluated as where B is the proportion of biomass removed (assumed constant over time) and W is the mass of water (t ha−1) that a 1 cm of soil can hold, that is, essentially the pore space of the soil. The values for the contaminant mass in the soil can be updated as
假定根系生长至深度DR并在第d = 1, … , DR层中均匀分布,则通过植物吸收从某一土层中移出的污染物质量可计算为 式中,B为生物量移出比例(假定不随时间变化),W为1 cm土层可容纳的水量(t ha−1),即本质上为土壤的孔隙空间。土壤中污染物质量的数值可更新为
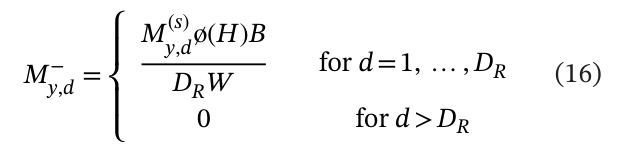

The plant uptake of the contaminant solution in year y can then be evaluated as Py(s) = ∑My−,d. (18) d
第y年植物对污染物溶液的吸收量可计算为Py(s) = ∑My−,d。(18) d
2.2.5 | Plant uptake2.2.5 | 植物吸收
Like the drainage and leaching function, plant uptake is calculated on a yearly timestep. Given the initial crop concentration i, the initial concentration of TE in soil C0 and the coefficient of adsorption K, the root adsorption factor can be calculated as
与排水与淋溶函数一样,植物吸收也以年为时间步长进行计算。给定作物初始浓度i、土壤中微量元素初始浓度C0以及吸附系数K,根系吸收因子可计算为
And after the proportion B is removed, the rest gets redistributed back into the soil prompting a further update so that and My,d remains otherwise unchanged. The annual TE loss owing to plant removal is thus
在移出比例B后,其余部分重新分配回土壤中,从而需进一步更新,即 而My,d在其他情况下保持不变。因此,因植物移出而造成的年微量元素损失为


The values for the contaminant mass in the soil can be updated as
土壤中污染物质量的数值可更新为
This parameter is dimensionless and represents the plant TE concentration/soil TE concentration quotient (Robinson et al., 2009). This is a simplified measure of the proportion of TE in soil solution taken up by plant roots which is dependent on various complex factors.
该参数无量纲,表示植物微量元素浓度与土壤微量元素浓度之商(Robinson et al., 2009)。这是对土壤溶液中被植物根系吸收的微量元素比例的简化度量,该比例取决于多种复杂因素。


For most TEs, plant uptake will be constant over time. The uptake of some TEs including Cu and Zn, however, is plant- regulated and uptake rates will change over soil solution concentration ranges (Wairich et al., 2022). The associated change in ø can be modelled with a decay constant N following Robinson et al. (2003):
对于大多数微量元素,植物吸收随时间保持恒定。然而,Cu和Zn等部分微量元素的吸收受植物调控,其吸收速率会随土壤溶液浓度范围而变化(Wairich et al., 2022)。ø的相应变化可参照Robinson et al. (2003)采用衰减常数N进行模拟:
The mass- balance model requires that the final TE mass in soil equals the initial TE mass in soil plus the TE mass added over the years minus the overall mass lost through plant uptake, leaching and run- off:
质量平衡模型要求土壤中最终的微量元素质量等于土壤中初始微量元素质量加上多年来添加的微量元素质量,再减去通过植物吸收、淋溶和径流损失的总质量:
ø(H) = ø1H1 (15) ∑d MY,d = ∑d M0,d + ∑y My+,∙ − ∑y (My(P) + My(L) + My(R)). H1 + N(H − H1) (22)
ø(H) = ø1H1 (15) ∑d MY,d = ∑d M0,d + ∑y My+,∙ − ∑y (My(P) + My(L) + My(R)). H1 + N(H − H1) (22)
This equation functions as a check for the model, to ensure it has run correctly and that no error has been introduced through the model processes.
该方程用作模型的检验,以确保模型运行正确,且在模型过程中未引入误差。
2.3 | Other relevant model assumptions and limitations2.3 | 其他相关模型假设与局限性
The model has several key assumptions to facilitate parameterization. Volatilization of TEs was assumed to be negligible and not included in the model processes. Exceptions to this assumption would include modelling Hg, Se and As under anaerobic conditions. The model assumes linear KD. We did not use a Freundlich equation for this parameter as a linear relationship was sufficient for the purposes of this model, for use within the contaminant ranges for which it was developed: that is, those that are environmentally relevant and representative of sites with low to moderate levels of contamination such as agricultural soils, as opposed to heavily contaminated sites such as mine spoils (Clothier et al., 1988). The model does not account for lateral movement of water and TEs within the soil or use macropore flow elements. Consideration of macropore flow is more relevant for modelling of groundwater and receiving waters and therefore we considered it unnecessary for the purposes of modelling soil TE accumulation. The model does not account for a change in variables over the course of the simulation, for example, a change in soil bulk density occurring over the simulation time. All input variables are assumed constant throughout the course of the simulation.
为便于参数化,模型设定了若干关键假设。微量元素的挥发被假定可忽略不计,未纳入模型过程。该假设的例外情况包括在厌氧条件下模拟Hg、Se和As。模型假定KD为线性。我们未对该参数采用Freundlich方程,因为在模型所针对的污染物浓度范围内,线性关系已足以满足本模型的需要:即环境相关浓度,代表农业土壤等低至中度污染的场地,而非矿山废弃物等重度污染场地(Clothier et al., 1988)。模型未考虑水和微量元素在土壤中的横向迁移,也未采用大孔隙流要素。大孔隙流对于地下水和受纳水体的建模更为相关,因此我们认为在模拟土壤微量元素累积时无需考虑。模型未考虑变量在模拟过程中的变化,例如模拟期间土壤容重的变化。所有输入变量在整个模拟过程中均假定为常数。
43 | MODEL VALIDATION3 | 模型验证
To validate the model, we used a data set from an agricultural site with a known history of contaminant inputs. The Winchmore long- term fertilizer trials have been running in Canterbury, New Zealand, since 1952, and have measured the concentrations of TEs including F, Cd and U in soil under different fertilizer regimes over time (Rickard & Moss, 2012). The Winchmore trials have a known fertilizer history, including known contaminant concentrations of the fertilizers applied. Parameters including annual irrigation, pasture production and climate parameters are well documented for these trials (Gray & Moss, 2021; Rickard & Moss, 2012). This provides an ideal data set for model validation, as both inputs and accumulation of TEs have been measured over a period of ca. 70 years. Sites such as Winchmore are rare and to the best of our knowledge, no such sites with known histories exist in tropical regions where oil palm is grown. Therefore, we used the Winchmore data set to validate the model before applying it to tropical oil palm systems.
为验证模型,我们使用了来自一个污染物输入历史已知的农业场地的数据集。Winchmore长期施肥试验自1952年起在新西兰坎特伯雷开展,测定了不同施肥制度下土壤中F、Cd和U等微量元素浓度随时间的变化(Rickard & Moss, 2012)。Winchmore试验的施肥历史已知,包括所施化肥中的污染物浓度。这些试验的年灌溉量、牧草产量和气候参数等均有详细记录(Gray & Moss, 2021; Rickard & Moss, 2012)。由于微量元素的输入和累积均已测定了约70年,这为模型验证提供了理想的数据集。像Winchmore这样的场地十分罕见,据我们所知,在种植油棕的热带地区尚不存在此类历史已知的场地。因此,我们在将模型应用于热带油棕系统之前,先利用Winchmore数据集对模型进行了验证。
At the Winchmore trial site, two trials were run with single superphosphate applied to pastoral soil plots at rates of 188 and 376 kg ha−1 year−1 (equiv) (McDowell et al., 2021). These trial plots are hereafter referred to as the 188 and 376 trial plots, respectively. The F, Cd and U concentrations of soils under each trial plot were measured at various time points since the commencement of the experiments. Cadmium had been measured in soils for 64 years, F for 63 years and U for 51 years. The Cd and U concentrations of applied fertilizers were also measured at several time points (McDowell et al., 2021). This data provided known contaminant input model parameters and measures against which to compare our model outputs. Model inputs were determined for each parameter detailed in Table 2. Where data specific to the Winchmore site was not available, literature values were sourced from studies with conditions as close as possible to the conditions at Winchmore. A full list of model inputs used can be viewed in Table S2.
在Winchmore试验点,开展了两项试验,分别以188和376 kg ha−1 year−1(当量)的施用量向牧场土壤小区施用过磷酸钙(McDowell et al., 2021)。以下将这两个试验小区分别称为188和376试验小区。自试验开始以来,在多个时间点测定了各试验小区土壤中的F、Cd和U浓度。土壤Cd已测定64年,F测定63年,U测定51年。所施化肥中的Cd和U浓度也在若干时间点进行了测定(McDowell et al., 2021)。这些数据提供了已知的污染物输入模型参数,以及可与模型输出进行比较的实测值。表2中所列的每个参数均确定了模型输入值。若无Winchmore场地的特定数据,则采用条件尽可能接近Winchmore的研究中的文献值。所用模型输入的完整列表见表S2。
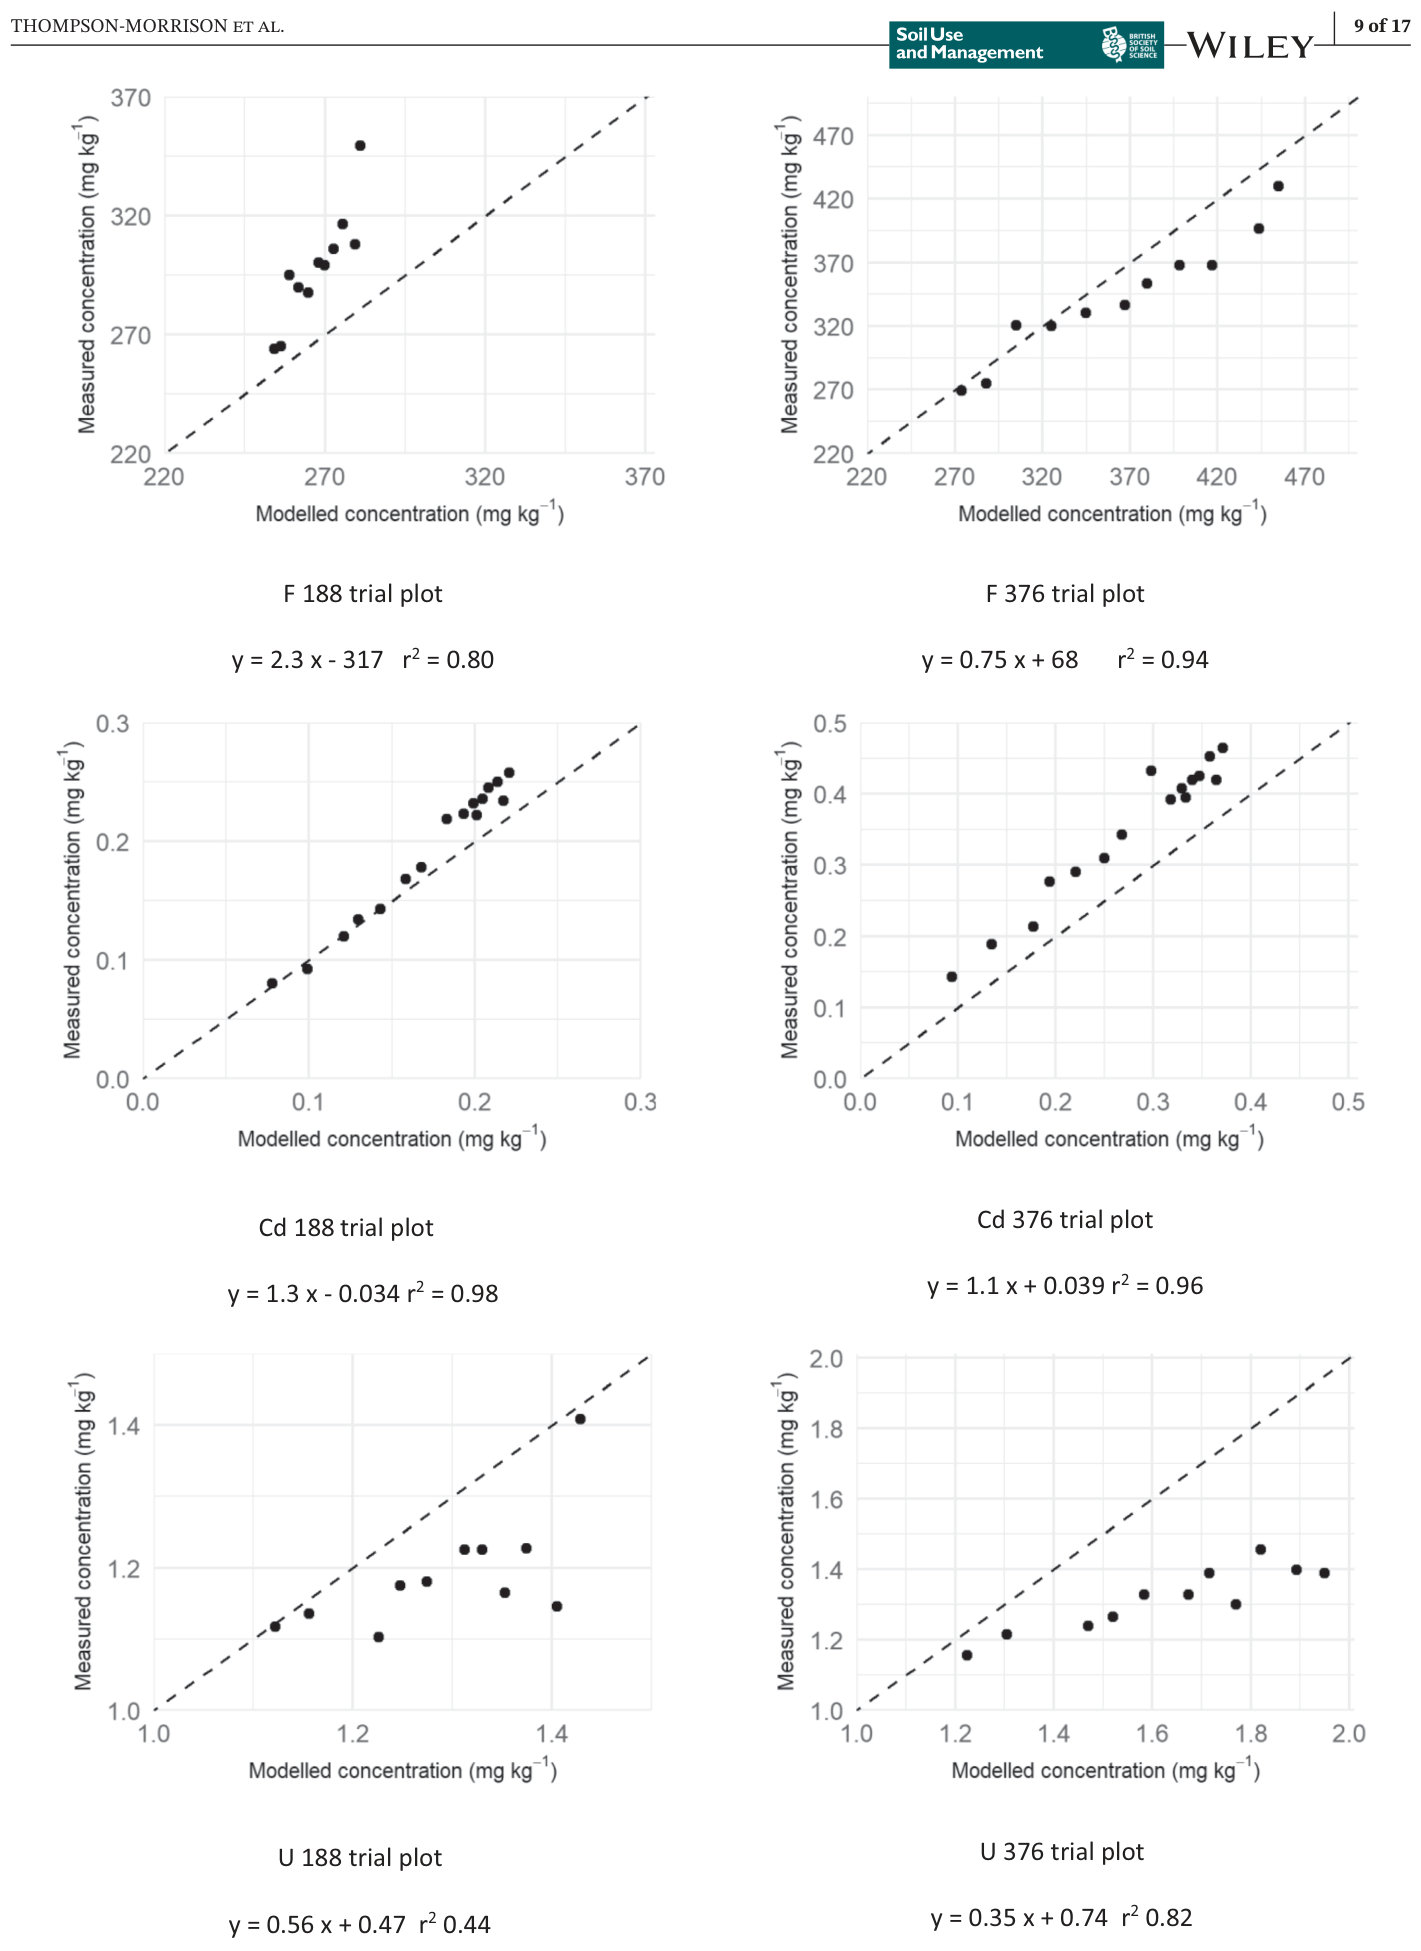
To determine our model's accuracy at determining TE concentrations in soil after a specified number of years, scenarios were modelled with a simulation time equal to every year of the Winchmore trials that a specific TE was measured in. This was not the same between TEs: Cd was measured and hence modelled 16 times over 64 years, while F was measured 11 times over 63 years and U was measured and modelled 11 times over 51 years. The soil concentrations produced by the model were compared with the measured soil concentrations from the fertilizer trial (Figure 2). In each plot presented, each point corresponds to a point in time when the TE concentration was measured in the soil from the trial plot (16 for Cd, 11 each for F and U). Over the simulation time of 64 years, on average, the model produced likely concentrations of Cd in soils of 92% (range: 84%– 108%) and 78% (range: 66%– 87%) of the measured concentration for the 188 and 376 trial plots, respectively. Likely, F soil concentrations over 63 years simulation time on average were 90% (range: 80%– 97%) and 106% (range: 95%– 113%) of measured concentrations in the 188 and 376 trial plots respectively. Over 51 years, likely U soil concentrations in the 188 and 376 trial plots were calculated by the model, on average, to be 109% (range: 100%– 123%) and 123% (range: 106%– 140%) of measured concentrations, respectively. The measurement of both F and U concentrations in soils encounters analytical challenges (Boschetti et al., 2017; del Carmen Lamas, 2005) and the variability and fluctuating concentrations of measured U in particular may be due to this. There is little published on the KD of F and the value used in the modelling was determined by the authors' best judgement from literature values (Nakamura et al., 2017).
为确定模型计算特定年数后土壤中微量元素浓度的准确性,我们以Winchmore试验中测定某一微量元素的每一年份作为模拟时间进行情景模拟。不同微量元素之间的情况不同:Cd在64年中测定并相应模拟了16次,F在63年中测定了11次,U在51年中测定并模拟了11次。将模型得出的土壤浓度与施肥试验中实测的土壤浓度进行比较(图2)。在所示的各图中,每个点对应试验小区土壤中微量元素浓度的一个测定时间点(Cd为16个,F和U各为11个)。在64年的模拟时间内,对于188和376试验小区,模型得出的土壤Cd可能浓度平均分别为实测浓度的92%(范围:84%– 108%)和78%(范围:66%– 87%)。在63年的模拟时间内,188和376试验小区中F的可能土壤浓度平均分别为实测浓度的90%(范围:80%– 97%)和106%(范围:95%– 113%)。在51年内,模型计算得出188和376试验小区中U的可能土壤浓度平均分别为实测浓度的109%(范围:100%– 123%)和123%(范围:106%– 140%)。土壤中F和U浓度的测定均存在分析上的困难(Boschetti et al., 2017; del Carmen Lamas, 2005),尤其是U实测浓度的变异和波动可能与此有关。关于F的KD的已发表资料很少,建模中所用的数值是作者根据文献值作出的最佳判断(Nakamura et al., 2017)。
Root mean square error (RMSE) and mean error (ME) were calculated for each modelled scenario using log- transformed values so as to make errors comparable between scenarios (Table 3). The model tended to underestimate concentrations of Cd in both trial plots and F in the 188 trial plot, indicated by negative ME values. No error measurements for other models identified in Table 1 could be found for comparison, however, the CadBal model from New Zealand was found to be accurate to within 90% of measured concentrations after 41 years (Gray & Cavanagh, 2022)
采用对数转换值计算了各模拟情景的均方根误差(RMSE)和平均误差(ME),以使不同情景之间的误差具有可比性(表3)。ME为负值表明,模型往往低估了两个试验小区中的Cd浓度以及188试验小区中的F浓度。未能找到表1中其他模型的误差测定结果以供比较,但新西兰的CadBal模型在41年后的精度可达实测浓度的90%以内(Gray & Cavanagh, 2022)

| Element元素 | Trial plot试验小区 | RMSERMSE | ME |
|---|---|---|---|
| F | 188 | 0.12 | −0.11 |
| 376 | 0.07 | 0.06 | |
| Cd | 188 | 0.11 | −0.08 |
| 376 | 0.26 | −0.25 | |
| U | 188 | 0.10 | 0.08 |
| 376 | 0.22 | 0.21 |
54 | MODELLED TRACE ELEMENTS IN PALM PRODUCTION SOILS4 | 油棕生产土壤中微量元素的模拟
We applied the model to an active oil palm plantation in Sumatra, Indonesia to determine whether TE accumulation was likely to occur as a result of agrichemicals used in production. Should accumulation be likely to occur, we also sought to understand the timeframes before SGVs were exceeded. The plantation used is described in Thompson- Morrison et al. (2022a) (Site C). This plantation was a smallholder plantation with flat topography soils classified as Acrisols (FAO, 2015) or Oxisols (USDA, 1999). Soils had a silt loam texture class, average pH of 5.1 and C and N concentrations of 2.1% and 0.035%, respectively (Thompson- Morrison et al., 2022a). Previous analysis of the TE concentrations of soil and plant materials from this plantation are detailed in Thompson- Morrison et al. (2022a) and Thompson- Morrison et al. (2022b), respectively. The soil and plant material at this site were deficient in N, P, K, magnesium (Mg) and molybdenum (Mo). Four TEs were modelled: Cu, because of its application in Cu fungicide and F, Cd and U because of their presence in phosphate fertilizers used in oil palm production.
我们将模型应用于印度尼西亚苏门答腊的一个现有油棕种植园,以确定生产中使用的农用化学品是否可能导致微量元素累积。若可能发生累积,我们还试图了解超过土壤指导值之前的时间尺度。所用种植园见Thompson- Morrison et al. (2022a)(场地C)。该种植园为小农种植园,地形平坦,土壤归类为Acrisols(FAO, 2015)或Oxisols(USDA, 1999)。土壤质地为粉砂壤土,平均pH为5.1,C和N浓度分别为2.1%和0.035%(Thompson- Morrison et al., 2022a)。此前对该种植园土壤和植物材料中微量元素浓度的分析分别详见Thompson- Morrison et al. (2022a)和Thompson- Morrison et al. (2022b)。该场地的土壤和植物材料缺乏N、P、K、镁(Mg)和钼(Mo)。共模拟了四种微量元素:Cu,因其在铜杀菌剂中的施用;以及F、Cd和U,因其存在于油棕生产所用的磷肥中。
4.1 | Model input parameters4.1 | 模型输入参数
Two timeframes of 8 and 50 years were chosen for the modelled scenario (Table 4). These represented both a midand long- term analysis. The 8- year timeframe was chosen to determine whether any degradation to soil as a result of TE accumulation will have occurred by the year that the United Nations Sustainable Development Goals (SDGs) are to be met (i.e. 2030). Soil quality is paramount to several of the SDGs, including SDG2: zero hunger, SDG6: clean water and sanitation, SDG12: responsible production and consumption, SDG13: climate action and SDG15: life on land (European Environment Agency, 2019). The 50- year timeframe was chosen to determine the sustainability of current recommended inputs into the next half century, as oil palm production is expected to continue and expand within this timeframe (Murphy et al., 2021).
模拟情景选择了8年和50年两个时间尺度(表4),分别代表中期和长期分析。选择8年时间尺度,是为了确定到联合国可持续发展目标(SDGs)的实现年份(即2030年)时,是否已因微量元素累积而出现土壤退化。土壤质量对多个可持续发展目标至关重要,包括SDG2:零饥饿、SDG6:清洁饮水和卫生设施、SDG12:负责任的生产和消费、SDG13:气候行动以及SDG15:陆地生物(European Environment Agency, 2019)。选择50年时间尺度,是为了确定当前推荐输入量在未来半个世纪内的可持续性,因为预计在此期间油棕生产将持续并扩大(Murphy et al., 2021)。
| General parameters一般参数 | |
|---|---|
| Simulation time (year) | 8; 50 |
| Simulation depth (cm) | 50 |
| Rainfall and irrigation (mm year−1) | 2950a |
| Evapotranspiration (mm year−1) | 1538b |
| Soil parameters | |
| Initial contaminant concentration (mg kg−1) | [contaminant specific] |
| Erosive loss (t ha−1year−1) | 5c |
| KD | [contaminant specific] |
| Bulk density (t m3 – 1) | 1.36 |
| Porosity (%) | 49d |
| Plant parameters | |
| Dry biomass produced (t ha−1year−1) | 10e |
| Biomass removed from site (%) | 100e |
| Root depth (cm) | 30f |
| Initial contaminant concentration (mg kg−1) | [Contaminant specific] |
| Decay constant | [Contaminant |
specific] | |
| Contaminant parameters | |
| Mass applied (g ha−1year−1) | [Contaminant specific] |
| Atmospheric deposition (g ha−1year−1) | [Contaminant specific] |
| Incorporation depth (cm) | 1 |
aRochayati et al. (2010). bTakizawa et al. (2009). cAflizar et al. (2018). A total of 48% of area in a measured watershed had erosion up to 5 t ha year. Erosion up to >200 t ha−1 year−1 was reported in this study. However, at rates this high, the issue in questions becomes soil depletion rather than TE accumulation. dWasis (2012). eNg et al. (1999); Woittiez et al. (2018) specify 20 t ha−1 fresh fruit bunch, assumed 50% water. fIntara et al. (2018); Paramananthan (2015).
aRochayati et al. (2010)。bTakizawa et al. (2009)。cAflizar et al. (2018)。在一个实测流域中,共有48%的面积侵蚀量达5 t ha year。该研究报道的侵蚀量高达>200 t ha−1 year−1。然而,在如此高的速率下,所关注的问题变为土壤耗竭而非微量元素累积。dWasis (2012)。eNg et al. (1999);Woittiez et al. (2018)给出鲜果串产量为20 t ha−1,假定含水量为50%。fIntara et al. (2018);Paramananthan (2015)。
| Initial soil土壤初始 | Initial plant植物初始 | ||||
|---|---|---|---|---|---|
| Contaminant name | concentration (mg kg−1) | concentration (mg kg−1) | KD | Decay constant | Mass of contaminant added (g ha−1year−1) |
| Fluorine | 321 | 0.5 | 365 | 0 | 32,890 |
| Copper | 5.6 | 15 | 5643 | 0.1 | 14,432 |
| Cadmium | 0.085 | 0.012 | 227 | 0 | 54 |
| Uranium | 4 | 0.014 | 10,000 | 0 | 51 |
| Element元素 | Simulation time (year)模拟 时间(年) | Initial mass in soil (g)土壤中初始 质量(g) | Mass added to soil (g)添加到土壤 的质量(g) | Final mass in soil (g)土壤中最终 质量(g) | Final mass leached (g)最终淋溶 质量(g) | Final mass taken up by plants (g)最终 植物 吸收质量 (g) | Final mass lost with run- off (g)最终 随径流 损失质量(g) |
|---|---|---|---|---|---|---|---|
| F | 8 | 2,182,800 | 263,120 | 2,316,646 | 99,385 | 42 | 29,847 |
| 50 | 2,182,800 | 1,644,500 | 2,991,878 | 621,154 | 329 | 213,938 | |
| Cu | 8 | 38,080 | 115,456 | 134,826 | 112 | 1583 | 17,015 |
| 50 | 38,080 | 721,600 | 418,896 | 700 | 11,866 | 328,218 | |
| Cd | 8 | 578 | 432 | 932 | 42 | 1.5 | 34 |
| 50 | 578 | 2700 | 2741 | 265 | 25 | 247 | |
| U | 8 | 27,200 | 408 | 27,365 | 45 | 1.1 | 197 |
| 50 | 27,200 | 2550 | 27,809 | 282 | 7.2 | 1652 |
We modelled scenarios for F, Cd and U because of their presence in phosphate fertilizers, and Cu because of its application in Cu- fungicides which are used in oil palm plantations. Site- specific and contaminant- specific model input parameters were used to run each scenario (Tables 4 and 5, respectively).
我们对F、Cd和U进行了情景模拟,因为它们存在于磷肥中;对Cu进行模拟,则是因为油棕种植园中施用铜杀菌剂。每个情景的运行均采用了场地特定和污染物特定的模型输入参数(分别见表4和表5)。
Where possible, site- specific data was used to model the TE fluxes in the oil palm plantation. Where this data were not available, the literature values from areas with conditions as close as possible to the site were used. Initial soil and plant concentrations of Cu and Cd were taken from Thompson- Morrison et al. (2022a) (Table 5). Initial plant concentrations of Cu and Cd were calculated as site- specific weighted mean kernel and mesocarp concentrations, as these plant materials are removed from the site during harvest. Literature values were used for F (Kumar, 2014; Mason & Moore, 1982) and U (Evans & Eriksson, 1983; Taylor et al., 2016) where there was no sitespecific information available. Literature KD values were used for Cd (USEPA, 1999), F (Nakamura et al., 2017) and U (USEPA, 1999) while Cu was site- specific (Thompson- Morrison et al., 2022a). A decay constant of 0 was used for non- essential TEs F, Cd and U while 0.1 was used for Cu as the uptake of this element is plant- regulated (Wairich et al., 2022).
在可能的情况下,采用场地特定数据模拟油棕种植园中的微量元素通量。若无此类数据,则采用条件尽可能接近该场地的地区的文献值。Cu和Cd的土壤和植物初始浓度取自Thompson- Morrison et al. (2022a)(表5)。Cu和Cd的植物初始浓度按场地特定的果仁和中果皮浓度加权平均值计算,因为这些植物材料在收获时被移出场地。在无场地特定信息的情况下,F(Kumar, 2014; Mason & Moore, 1982)和U(Evans & Eriksson, 1983; Taylor et al., 2016)采用文献值。Cd(USEPA, 1999)、F(Nakamura et al., 2017)和U(USEPA, 1999)采用文献KD值,而Cu采用场地特定值(Thompson- Morrison et al., 2022a)。非必需微量元素F、Cd和U的衰减常数取0,而Cu取0.1,因为该元素的吸收受植物调控(Wairich et al., 2022)。
The mass of contaminant added through fertilizers was calculated from TE contaminant rates in NPK (15– 15- 15) fertilizer (Oosterhuis et al., 2000; Taylor et al., 2016).
通过化肥添加的污染物质量根据NPK(15– 15- 15)肥料中的微量元素杂质含量计算(Oosterhuis et al., 2000; Taylor et al., 2016)。
NPK fertilizer was used as this was identified as the most commonly used fertilizer in a survey of smallholder plantations in Sumatra by Woittiez et al. (2018). Application rates were based on recommended per- palm P application rates to support oil palm production from Woittiez et al. (2015) using a recommended tree density of 143 trees ha−1 from FAO (1990). The maximum rate recommended by Woittiez et al. (2018) was used as the soils at this site were deficient in P. In the modelled scenario, this application was applied as maintenance fertilizer every year. Applications of initial capital fertilizer were not modelled because of the high application rates of maintenance fertilizer and the increased likelihood of nutrient runoff via overland flow in tropical environments with high rainfall. The modelled application rate of Cu was based on the mean fungicide application rate in Indonesian horticulture reported by Adiyoga and de Putter (2015) with the addition of 64 g ha−1 year−1 added as NPK contaminants (Taylor et al., 2016).
之所以采用NPK肥料,是因为Woittiez et al. (2018)对苏门答腊小农种植园的调查表明其为最常用的肥料。施用量依据Woittiez et al. (2015)为支持油棕生产而推荐的单株P施用量,并采用FAO (1990)推荐的143 trees ha−1种植密度。由于该场地土壤缺P,采用了Woittiez et al. (2018)推荐的最大施用量。在模拟情景中,该施用量作为维持性肥料每年施用一次。由于维持性肥料施用量较高,且在高降雨热带环境中养分经地表漫流流失的可能性增大,因此未模拟初始基础肥料的施用。Cu的模拟施用量依据Adiyoga and de Putter (2015)报道的印度尼西亚园艺杀菌剂平均施用量,另加作为NPK杂质带入的64 g ha−1 year−1(Taylor et al., 2016)。
4.2 | Model outputs4.2 | 模型输出
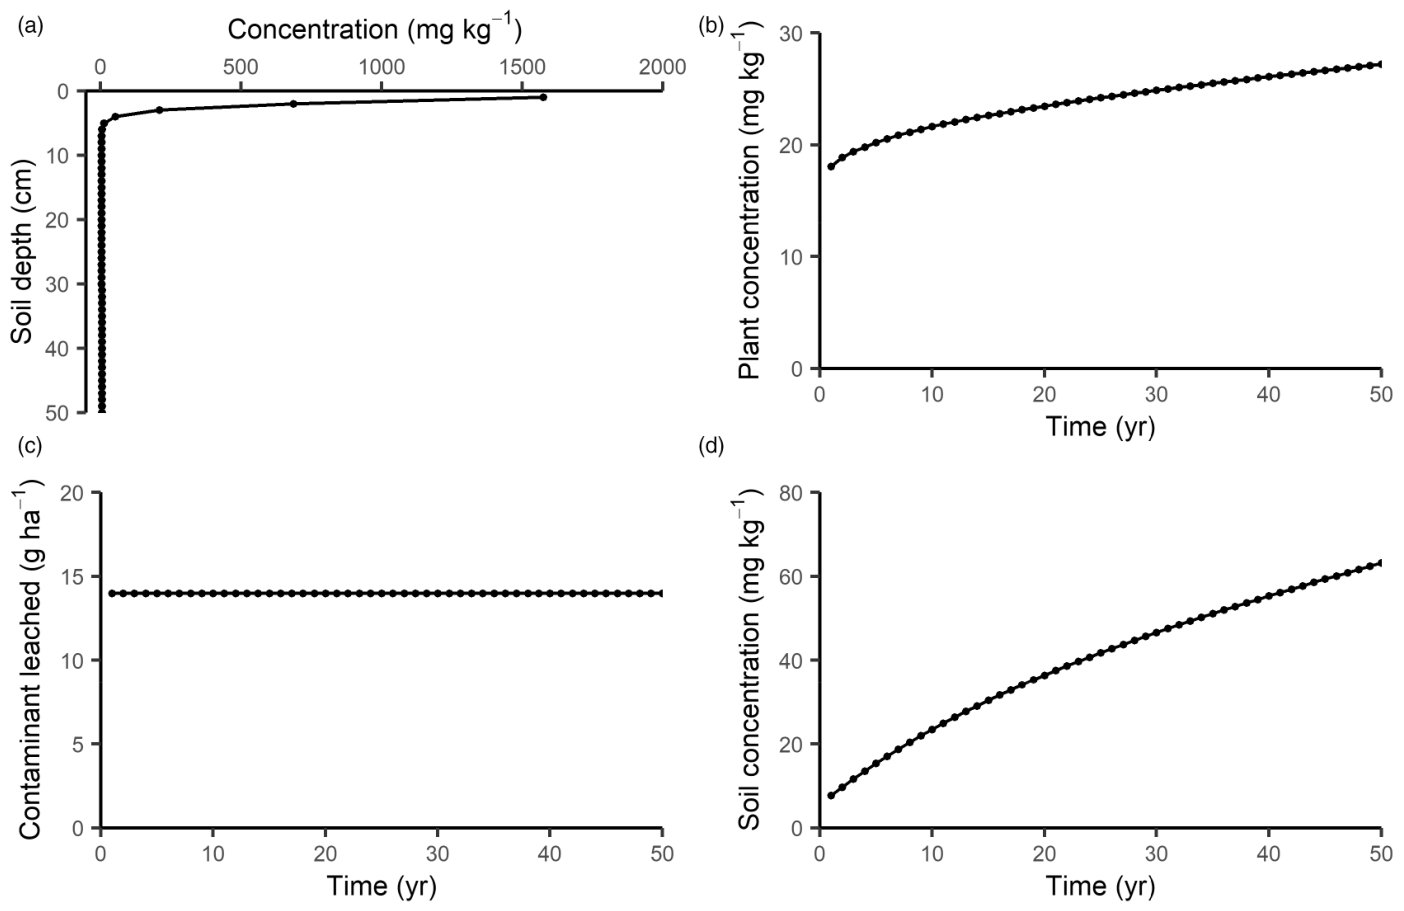
For each scenario modelled, a mass- balance output was produced (Table 6). We also produced four figures from modelling results, corresponding with contaminant concentration in the final soil profile, the plant concentration of contaminant over the simulation time, the mass of contaminant leached over the simulation time and the contaminant concentration in soil over the simulation time (Figure 3).
对每个模拟情景均生成了质量平衡输出(表6)。我们还根据模拟结果绘制了四幅图,分别对应最终土壤剖面中的污染物浓度、模拟期间植物中的污染物浓度、模拟期间污染物的淋溶质量以及模拟期间土壤中的污染物浓度(图3)。
4.3 | Implications for oil palm production4.3 | 对油棕生产的启示
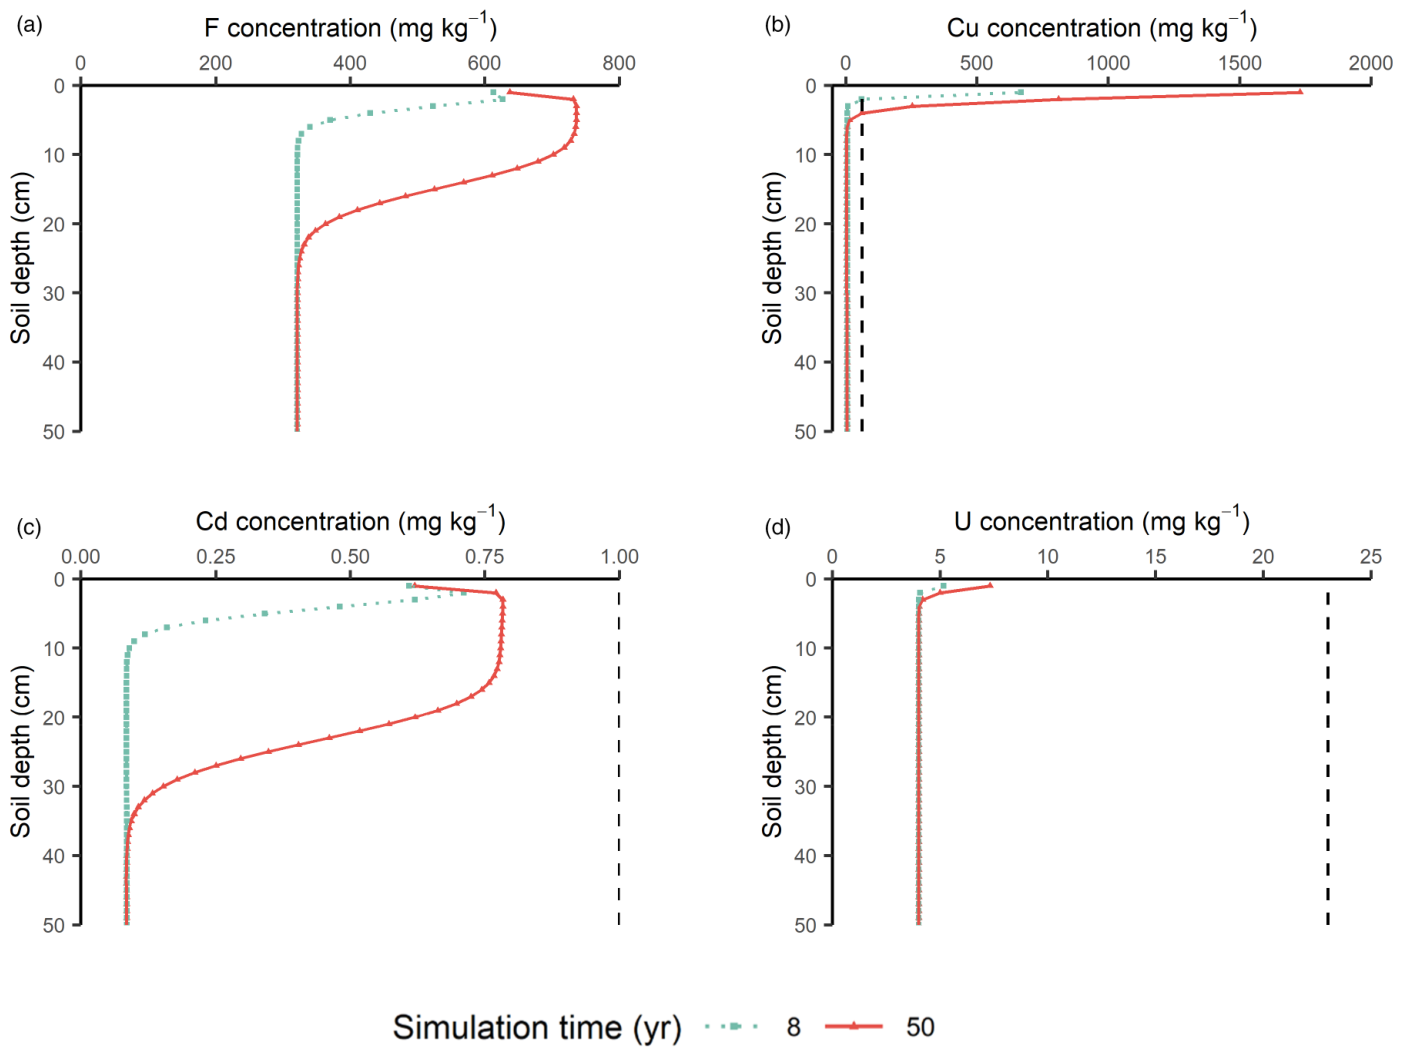
The modelling results indicate that accumulation of Cu, Cd and F above initial soil concentrations can be expected over time in the oil palm plantation because of NPK fertilizer and Cu- based fungicide applications (Figure 4). The amount of U added in fertilizer applications was low enough to effect no substantial change to background soil concentrations. The modelled concentrations of Cu surpassed SGVs within 8 years while Cd and U did not surpass SGVs after 50 years. No SGV was used for F: only one relevant SGV could be identified for F, of 210 mg kg−1 (Cavanagh & Munir, 2016). This SGV was developed in New Zealand where F concentrations in soils are lower than the world average used in the modelled scenario, and therefore, this SGV was not suitable as a guideline for F concentrations in Indonesian soil. Fluorine topsoil concentrations in the modelled scenarios rose sharply within 8 years and more than doubled after 50 years, indicating that F accumulation in soils is likely to occur to potentially phytotoxic concentrations— estimated at 30– 300 mg kg−1 for most plant species by Cronin et al. (2000)— in soils under oil palm cultivation. All TEs tended to accumulate in the topsoil and move down the soil profile over time. Fluorine accumulated in the topsoil (0– 10 cm depth) to average concentrations of 419 and 719 mg kg- 1 after 8 and 50 years, respectively, while Cu accumulated to average concentrations down to 10 cm depth of 77 and 289 mg kg−1 after 8 and 50 years, respectively. At these concentrations, SGVs for Cu are surpassed and phytotoxicity of both TEs is likely to impede production. Accumulation of F in soils may also be detrimental as it can contribute to soil degradation under dealumination processes (Taylor et al., 2012; Taylor & Kim, 2009). The use of phosphate fertilizers and Cu fungicides in E. guineensis plantations presents risks to the sustainability of this system because of the presence of TE contaminants. We expect that SGVs for Cu and F will be exceeded within 8 years and production will become unviable because of degraded soil and phytotoxic TE concentrations. This is not consistent with meeting SDGs that rely on soil quality. As TE accumulation in soils has been reported in oil palm plantations in
模拟结果表明,由于施用NPK肥料和铜基杀菌剂,油棕种植园中Cu、Cd和F预计将随时间累积至高于土壤初始浓度的水平(图4)。随化肥施入的U量较低,不足以使土壤背景浓度发生实质性变化。Cu的模拟浓度在8年内即超过土壤指导值,而Cd和U在50年后仍未超过土壤指导值。F未采用土壤指导值:仅找到一个相关的F土壤指导值,为210 mg kg−1(Cavanagh & Munir, 2016)。该指导值是在新西兰制定的,新西兰土壤中的F浓度低于模拟情景中所采用的世界平均值,因此该指导值不适合作为印度尼西亚土壤F浓度的指导值。模拟情景中表土F浓度在8年内急剧上升,50年后增加一倍以上,表明在油棕种植土壤中,F可能累积至潜在植物毒性浓度——Cronin et al. (2000)估计大多数植物物种的该浓度为30– 300 mg kg−1。所有微量元素均倾向于在表土中累积,并随时间沿土壤剖面向下迁移。F在表土(0– 10 cm深度)中累积,8年和50年后的平均浓度分别为419和719 mg kg- 1;而Cu在10 cm深度以内累积,8年和50年后的平均浓度分别为77和289 mg kg−1。在这些浓度下,Cu超过土壤指导值,两种微量元素的植物毒性均可能阻碍生产。F在土壤中的累积还可能有害,因为它可通过脱铝过程导致土壤退化(Taylor et al., 2012; Taylor & Kim, 2009)。由于存在微量元素杂质,在E. guineensis种植园中施用磷肥和铜杀菌剂对该系统的可持续性构成风险。我们预计Cu和F的土壤指导值将在8年内被超过,且由于土壤退化和植物毒性微量元素浓度,生产将变得不可行。这与实现依赖土壤质量的可持续发展目标不相符。由于在以下地区的油棕种植园中已有土壤微量元素累积的报道:
Nigeria (Olafisoye et al., 2016, 2020) and Malaysia (Aini Azura et al., 2012), we see this as an emerging issue for the industry. Management practices which minimize TE inputs to soil may be researched and adopted in oil palm cultivation to minimize this risk.
尼日利亚(Olafisoye et al., 2016, 2020)和马来西亚(Aini Azura et al., 2012),我们认为这是该产业正在显现的问题。可研究并在油棕种植中采用尽量减少土壤微量元素输入的管理措施,以降低这一风险。
Our modelling results indicate that if sufficient nutrients were applied to oil palm soils, accumulation of Cu and F would be much greater than it currently is. This current oil palm production system can be described as low intensity, with low levels of nutrients in the soil– plant system. This equates to a system with low land use efficiency (LUE). A lower LUE results in higher labour costs because of harvesting over a large area. A low LUE also results in larger areas of land being cleared to meet production. If the LUE of this system were increased through increasing the nutrient concentrations in the soil– plant system, TE accumulation in soils would likely be exacerbated. Therefore, fertilizer subsidies that incentivize oil palm agriculture in Indonesia and lead to low nutrient levels in soils (Woittiez et al., 2018) may also have the effect of reducing soil contamination— as nutrient levels are low, so too are TE levels in soil. This however comes at the expense of clearing native forests as more land is required for production (Vijay et al., 2016). Trace element accumulation in soils under oil palm production in Indonesia is an issue that should be recognized and addressed, as the current state of production is not sustainable in terms of its impacts on soil quality.
模拟结果表明,若向油棕土壤施用充足的养分,Cu和F的累积将远高于目前水平。当前的油棕生产系统可称为低强度系统,土壤–植物系统中的养分水平较低,相当于土地利用效率(LUE)较低的系统。较低的LUE意味着需在大面积范围内收获,因而劳动力成本较高;较低的LUE还会导致为满足产量而开垦更大面积的土地。若通过提高土壤–植物系统中的养分浓度来提高该系统的LUE,土壤中微量元素的累积可能会加剧。因此,印度尼西亚激励油棕种植并导致土壤养分水平偏低的化肥补贴政策(Woittiez et al., 2018)也可能具有减轻土壤污染的作用——由于养分水平较低,土壤中的微量元素水平也较低。然而,这是以砍伐原生森林为代价的,因为生产需要更多土地(Vijay et al., 2016)。印度尼西亚油棕生产土壤中的微量元素累积是一个应当得到重视和解决的问题,因为就其对土壤质量的影响而言,当前的生产状况是不可持续的。
65 | CONCLUSIONS5 | 结论
To calculate likely timeframes and limiting elements associated with TE accumulation in oil palm plantation soils owing to agrichemical applications, we have developed a mass- balance model to calculate the likely concentrations of TEs including F, Cu, Cd and U in production soils into the future. The model is rationally convenient, working with environmentally relevant concentrations, and is both parsimonious and mechanistic. This model is suitable for use with agricultural systems which receive some form of TE input and is applied at the hectare scale. This model has been validated with the Winchmore data set for Cd, F and U over timeframes of up to 64 years. The results of our modelling of oil palm plantation soils in Indonesia with recommended fertilizer inputs indicate that production will become unviable at this site because of phytotoxic concentrations of Cu and F within 50 years. In the modelled scenario, topsoil concentrations reached up to 289 and 719 mg kg−1 of Cu and F, respectively, within 50 years. While current nutrient levels in some production soils are low and likely to impede production, our findings indicate that if these deficiencies were corrected, TE accumulation would come to limit production. This ultimately brings the viability of this production system on weathered, acidic soils such as those in Indonesia, into question.
为计算农用化学品施用导致油棕种植园土壤微量元素累积的可能时间尺度及限制性元素,我们建立了质量平衡模型,用于计算未来生产土壤中F、Cu、Cd和U等微量元素的可能浓度。该模型使用便捷,采用具有环境意义的浓度,既简约又具有机理性。该模型适用于接受某种形式微量元素输入的农业系统,并以公顷尺度应用。该模型已利用Winchmore数据集对Cd、F和U在长达64年的时间尺度上进行了验证。对采用推荐施肥量的印度尼西亚油棕种植园土壤的模拟结果表明,由于Cu和F达到植物毒性浓度,该地点的生产将在50年内变得不可行。在模拟情景中,50年内表土Cu和F浓度分别高达289和719 mg kg−1。尽管目前部分生产土壤养分水平较低并可能制约生产,但我们的研究结果表明,若纠正这些养分缺乏,微量元素累积将成为限制生产的因素。这最终使得在印度尼西亚等地的风化酸性土壤上该生产系统的可行性受到质疑。
This model could be validated further using different data sets. It may also be possible to incorporate yearspecific TE application rates which are not constant, as in the current model, to allow for varying application rates over time. As the current model is deterministic, introducing uncertainty factors may improve the usefulness of predictions. This may be introduced into the model using Monte Carlo simulations. As the focus of the current work was to use the model as a tool for the assessment of likely TE accumulation in oil palm soils into the future, this work will be carried out in future, separate publications.
该模型可利用不同数据集作进一步验证。还可以纳入逐年变化而非如当前模型中恒定的微量元素施用量,以考虑施用量随时间的变化。由于当前模型为确定性模型,引入不确定性因子可能提高预测的实用性,这可通过蒙特卡罗模拟引入模型。由于本研究的重点是将该模型作为评估油棕土壤未来可能微量元素累积的工具,上述工作将在今后单独发表的论文中开展。
7ACKNOWLEDGMENTS致谢
The authors would like to acknowledge the work of AgResearch and others involved in maintaining the Winchmore fertiliser trials and curating the data. We also thank the funders of this project for supporting this work. Open access publishing facilitated by University of Canterbury, as part of the Wiley - University of Canterbury agreement via the Council of Australian University Librarians.
作者感谢AgResearch及其他参与维护Winchmore肥料试验和整理数据的人员所做的工作。我们还感谢本项目资助方对本研究的支持。本文的开放获取出版由坎特伯雷大学资助,属于通过澳大利亚大学图书馆员委员会签订的Wiley–坎特伯雷大学协议的一部分。
8CONFLICT OF INTEREST STATEMENT利益冲突声明
The authors have no competing interests to declare that are relevant to the content of this article.
作者声明不存在与本文内容相关的竞争性利益。
9DATA AVAILABILITY STATEMENT数据可用性声明
The data that supports the findings of this study are available in the supplementary material of this article.
支持本研究结果的数据见本文补充材料。
10ORCIDORCID
Hadee Thompson- Morrison https://orcid. org/0000-0002-4509-152X Sally Gaw https://orcid.org/0000-0002-9556-3089
Hadee Thompson- Morrison https://orcid. org/0000-0002-4509-152X Sally Gaw https://orcid.org/0000-0002-9556-3089
11REFERENCES参考文献
Adiyoga, W., & de Putter, H. (2015). Pesticide use in shallot- hot pepper intercropping cultivation system in Brebes. Central Java. Acta Hortic., 1105, 229– 334. https://doi.org/10.17660/ actah ortic.2015.1105.32
Aflizar, A., Alarima, C. I., & Masunaga, T. (2018). Effect of soil erosion and topography on distribution of cadmium (Cd) in Sumani watershed, West Sumatra. Indonesia. MATEC Web of Conferences, 229, 03001. https://doi.org/10.1051/matec conf/20182 2903001
Aini Azura, A., Fauziah, C. I., & Samsuri, A. W. (2012). Cadmium and zinc concentrations in soils and oil palm tissues as affected by long- term application of phosphate rock fertilizers. Soil and Sediment Contamination, 21(5), 586– 603. https://doi. org/10.1080/15320 383.2012.672485
Asati, A., Pichhode, M., & Nikhil, K. (2016). Effect of heavy metals on plants: An overview. International Journal of Application or Innovation in Engineering & Management, 5(3), 56– 66.
Besnard, E., Chenu, C., & Robert, M. (1999). Distribution of copper in champagne vineyards soils, as influenced by organic amendments 5th international conference on the biogeochemistry of trace elements. Austria.
Bhatti, S. M., Anderson, C. W. N., Stewarta, R. B., & Robinson, B. H. (2013). Risk assessment of vegetables irrigated with arseniccontainated water. Evnironmental Science Processes and Impacts, 15, 1866– 1875. https://doi.org/10.1039/c3em0 0218g
Bivi, M. S. H. R., Paiko, A. S., Khairulmazmi, A., Akhtar, M. S., & Idris, A. S. (2016). Control of basal stem rot disease in oil palm by supplementation of calcium, copper, and salicylic acid. Plant Pathology Journal, 32(5), 396– 406. https://doi.org/10.5423/PPJ. OA.03.2016.0052
Bolan, N., Adriano, D., & Mahimairaja, S. (2004). Distribution and bioavailability of trace elements in livestock and poultry manure by- products. Critical Reviews in Environmental Science and Technology, 34(3), 291– 338. https://doi.org/10.1080/10643 38049 0434128
Boschetti, W., Dessuy, M. B., Pizzato, A. H., & Vale, M. G. R. (2017, 2017/01/01/)). New analytical method for total fluorine determination in soil samples using high- resolution continuum source graphite furnace molecular absorption spectrometry. Microchemical Journal, 130, 276– 280. https://doi.org/10.1016/j. microc.2016.10.003
Canadian Council of Ministers of the Environment. (2007). Canadian soil quality guidelines for the protection of environmental and human health: Summary tables (Publication No. 1299) Author.
Cavanagh, J. (2014). Review of models to predict cadmium accumulation in agricultural soils. Manaaki Whenua Landcare Research.
Cavanagh, J., & Munir, K. (2016). Development of soil guideline values for the protection of ecological receptors (eco- SGVs): Technical document. Landcare Research.
Chaney, R. L. (1989). Toxic element accumulation in soils and crops: Protecting soil fertility and agricultural food chains. In B. Bar- Yosef, N. J. Barrow, & J. Goldshmid (Eds.), Inorganic contaminants in the vadose zone (pp. 140– 158). Springer.
Chang, A. C., Chen, W., Bar- Yosef, B., Page, A. L., & Kim, S. (2004). A generalized trace element mass balance model for cropland soils: Arsenic and cadmium. California Department of Food and Agriculture. https://www.cdfa.ca.gov/is/docs/MassB alance.pdf
Clothier, B. E., Green, S. R., & Sauer, T. J. (1988). The movement of ammonium nitrate into unsaturated soil during unsteady absorption. Soil Science Society of America Journal, 52(2), 340– 345. https://doi.org/10.2136/sssaj 1988.03615 99500 52000 20007x
Corley, R. H. V., & Tinker, P. B. H. (2015). The oil palm (5th ed.). Wiley https://books.google.co.nz/books ?id=71A1C AAAQBAJ
Cronin, S. J., Manoharan, V., Hedley, M. J., & Loganathan, P. (2000). Fluoride: A review of its fate, bioavailability, and risks of fluorosis in grazed- pasture systems in New Zealand. New Zealand Journal of Agricultural Research, 43, 295– 321. https://doi. org/10.1080/00288 233.2000.9513430
CSIRO. (2009). Investigation into the impacts of contaminants in mineral fertilisers, fertiliser ingredients and industrial residues and the derivation of guidelines for contaminants. (CSIRO land and water science report 25/09). https://publi catio ns.csiro.au/rpr/ downl oad?pid=proci te:66d7d 05d- 24cc- 473e- b0c7- a2f5f bdc1a c6&dsid=DS1
De Vries, W., & McLaughlin, M. J. (2013). Modeling the cadmium balance in Australian agricultural systems in view of potential impacts on food and water quality. Sci. Total Environ., 461- 462, 240– 257. https://doi.org/10.1016/j.scito tenv.2013.04.069
del Carmen Lamas, M. (2005). Factors affecting the availability of uranium in soils. Federal Agricultural Research Centre.
Elbana, T. A., & Selim, H. M. (2010). Cadmium transport in alkaline and acidic soils: Miscible displacement experiments. Soil Science Society of America Journal, 74(6), 1956– 1966. https:// doi.org/10.2136/sssaj 2010.0146
European Commission. (2004). Heavy metals and organic compounds from wastes used as organic fertilisers. https://ec.europa.eu/envir onmen t/pdf/waste/ compo st/hm_final report.pdf
European Environment Agency. (2019). Soil and the United Nations sustainable development goals. European Environment Agency. Retrieved 18th September, 2022, from https://www.eea.europa. eu/signa ls/signa ls- 2019- conte nt- list/infog raphi cs/soil- andunite d- natio ns- susta inabl e/view
FAO. (1990). The oil palm. Author.
FAO. (2015). World reference base for soil resources: International soil classification system for naming soils and creating legends for soil maps. World Soil Resources Reports.
Fungicide Resistance Action Committee. (2021). FRAC code list ©*2021: Fungal control agents sorted by cross resistance pattern and mode of action (including coding for FRAC groups on product labels). https://www.frac.info/docs/defau lt- sourc e/publi catio ns/frac- code- list/frac- code- list- 2021- - final.pdf?sfvrs n=f7ec4 99a_2
Gimeno- García, E., Andreu, V., & Boluda, R. (1996). Heavy metals incidence in the application of inorganic fertilizers and pesticides to rice farming soils. Environmental Pollution, 92(1), 19– 25. https://doi.org/10.1016/0269- 7491(95)00090 - 9
Gray, C., & Moss, R. (2021). Winchmore long- term fertiliser trial: 2020- 2021 annual update. AgResearch.
Gray, C. W., & Cavanagh, J.- A. E. (2022). The state of knowledge of cadmium in New Zealand agricultural systems: 2021. New Zealand Journal of Agricultural Research, 1– 51, 1– 51. https:// doi.org/10.1080/00288 233.2022.2069130
Intara, Y. I., Nusantara, A. D., Supanjani, S., Caniago, Z., & Ekawita, R. (2018). Oil palm roots architecture in response to soil humidity. International Journal of Oil Palm, 1(2), 79– 89.
Kissinger, G. (2016). Fiscal incentives for Indonesian palm oil production: Pathways for alignment with green growth. United Nations Environment Programme.
Kumar, B. (2014). Fluoride in Agricultral soil: A review on its sources and toxicity to plants. In G. C. Mishra (Ed.), Global sustainability transitions: Impacts and innovations (pp. 29– 37). Excellent Publishing House.
Liu, W., Yang, X., Duan, L., Naidu, R., Yan, K., Liu, Y., Wang, X., Gao, Y., & Chen, Y. (2021). Variability in plant trace element uptake across different crops, soil contamination levels and soil properties in the Xinjiang Uygur autonomous region of Northwest China. Scientific Reports, 11(2064), 2064. https://doi. org/10.1038/s4159 8- 021- 81764 - w
Loganathan, P., Hedley, M. J., Grace, N. D., Lee, J., Cronin, S. J., Bolan, N. S., & Zanders, J. M. (2003). Fertiliser contaminants in New Zealand grazed pasture with special reference to cadmium and fluorine: A review. Soil Research, 41(3), 501– 532. https:// doi.org/10.1071/SR02126
López- Alonso, M., García- Vaquero, M., Benedito, J. L., Castillo, C., & Miranda, M. (2012). Trace mineral status and toxic metal accumulation in extensive and intensive pigs in NW Spain. Livestock Science, 146(1), 47– 53. https://doi.org/10.1016/j. livsci.2012.02.019
Luo, L., Ma, Y., Zhang, S., Wei, D., & Zhu, Y.- G. (2009, 2009/06/01/)). An inventory of trace element inputs to agricultural soils in China. Journal of Environmental Management, 90(8), 2524– 2530. https://doi.org/10.1016/j.jenvm an.2009.01.011
Mason, B. H., & Moore, C. B. (1982). Principles of geochemistry. Wiley. https://books.google.co.nz/books ?id=K75gI AAACAAJ
McDowell, R. W., Moss, R. A., Gray, C. W., Smith, L. C., & Sneath, G. (2021). Seventy years of data from the world's longest grazed and irrigated pasture trials. Scientific Data, 8(53), 53. https:// doi.org/10.1038/s4159 7- 021- 00841 - x
McGrath, D., & Tunney, H. (2010). Accumulation of cadmium, fluorine, magnesium, and zinc in soil after application of phosphate fertilizer for 31 years in a grazing trial. Journal of Plant Nutrition and Soil Science, 173(4), 548– 553. https://doi. org/10.1002/jpln.20090 0140
Michaud, A. M., Cambier, P., Sappin- Didier, V., Deltreil, V., Mercier, V., Rampon, J.- N., & Houot, S. (2019). Mass balance and longterm soil accumulation of trace elements in arable crop systems amended with urban composts or cattle manure during 17 years. Environmental Science and Pollution Research, 27(5), 5367– 5386. https://doi.org/10.1007/s1135 69- 07166 - 8
Mills, T. M., Robinson, B. H., Sivakumaran, S., Arnold, B., Clothier, B. E., & Kim, N. (2005). Current practice and future land- use: The sustainability of productive sector environments. Acta Horticulturae, 694, 159– 164.
Mokany, K., Moore, A. D., Graham, P., & Simpson, R. J. (2010). Optimal management of fertiliser and stocking rate in temperate grazing systems. Animal Production Science, 50(1), 6. https://doi.org/10.1071/an09067
Molina, M., Aburto, F., Calderón, R., Cazanga, M., & Escudey, M. (2009). Trace element composition of selected fertilizers used in Chile: Phosphorus fertilizers as a source of Long- term soil contamination. Soil and Sediment Contamination, 18(4), 497– 511. https://doi.org/10.1080/15320 38090 2962320
Morgan, R. K., & Taylor, E. (2004). Copper accumulation in vineyard soils in New Zealand. Environmental Sciences, 1(2), 139– 167. https://doi.org/10.1080/15693 43051 23313 42602
MPOB. (2015). Chemical fertiliser Ganocare™ as preventive treatment in controlling ganoderma disease of oil palm (Malaysian Palm Oil Board TT No. 564). http://palmo ilis.mpob.gov.my/ publi catio ns/TOT/TT564 - Idris.pdf
Murphy, D. J., Goggin, K., & Paterson, R. R. M. (2021). Oil palm in the 2020s and beyond: Challenges and solutions. CABI Agriculture and Bioscience, 2(1), 1– 22. https://doi.org/10.1186/s4317 0- 021- 00058 - 3
Nakamura, K., Yasutaka, T., Kuwatani, T., & Komai, T. (2017). Development of a predictive model for lead, cadmium and fluorine soil– water partition coefficients using sparse multiple linear regression analysis. Chemosphere, 07, 501– 509. https://doi. org/10.1016/j.chemo sphere.2017.07.131
New Zealand Water & Wastes Association. (2003). Guidelines for the safe application of biosolids to land in New Zealand. Author.
Ng, H. P., Chew, P., Goh, K., & Kee, K. (1999). Nutrient requirements and sustainability in mature oil palms- an assessment. Planter, 75(880), 331– 345.
Obbard, J. P. (2001). Ecotoxicological assessment of heavy metals in sewage sludge amended soils. Applied Geochemistry, 16(11– 12), 1405– 1411. https://doi.org/10.1016/s0883 - 2927(01)00042 - 7
Olafisoye, B. O., Oguntibeju, O. O., & Osibote, O. A. (2016). An assessment of the bioavailability of metals in soils on oil palm plantations in Nigeria. Polish Journal of Environmental Studies, 25(3), 1125– 1140.
Olafisoye, O. B., Fatoki, O. S., Oguntibeju, O. O., & Osibote, O. A. (2020). Accumulation and risk assessment of metals in palm oil cultivated on contaminated oil palm plantation soils. Toxicology Reports, 7, 324– 334. https://doi.org/10.1016/j. toxrep.2020.01.016
Oosterhuis, F. H., Brouwer, F. M., & Wijnants, H. J. (2000). A possible EU wide charge on cadmium in phosphate fertilizers: Economic and environmental implications (IVM Institute for Environmental Studies, Vrije Universiteit report number E- 00/02 report to the European Commission). https://ec.europa. eu/envir onmen t/envec o/taxat ion/pdf/cadium.pdf
Paramananthan, S. (2015). Soil properties and their influence on oil palm management and yield. In International conference on oil palm and the environment. [Conference proceedings].
Rickard, D., & Moss, R. (2012). Winchmore and the long- term trials: The early history. New Zealand Journal of Agricultural Research, 55(2), 93– 103. https://doi.org/10.1080/00288 233.2012.662157
Roberts, T. L. (2014). Cadmium and phosphorous fertilizers: The issues and the science. Procedia Engineering, 83, 52– 59. https:// doi.org/10.1016/j.proeng.2014.09.012
Robinson, B., Fernandez, J., Madejon, P., Marañon, T., Murillo, J. M., Green, S., & Clothier, B. (2003). Phytoextraction: An assessment of biogeochemical and economic viability. Plant and Soil, 249, 117– 125.
Rocha, G. H. O., Lini, R. S., Barbosa, F., Batista, B. L., de Oliveira Souza, V. C., Nerilo, S. B., Bando, E., Mossini, S. A. G., & Nishiyama, P. (2014). Exposure to heavy metals due to pesticide use by vineyard farmers. International Archives of Occupational and Environmental Health, 88(7), 875– 880. https://doi. org/10.1007/s0042 0- 014- 1010- 1
Rochayati, S., Verloo, M., & Laing, G. D. (2010, 2010/08/04). Availability of cadmium and zinc as affected by the use of reactive phosphate rock, lime, and chicken manure on an indonesian acidic upland soil under field conditions. Communications in Soil Science and Plant Analysis, 41(16), 1986– 2003. https:// doi.org/10.1080/00103 624.2010.495808
Rys, G. J. (2011). A national cadmium management strategy for New Zealand agriculture. Cadmium Working Group.
Schneider, M., Keiblinger, K. M., Paumann, M., Soja, G., Mentler, A., Golestani- Fard, A., Retzmann, A., Prohaska, T., Zechmeister- Boltenstern, S., Wenzel, W., & Zehetner, F. (2019). Fungicide application increased copper- bioavailability and impaired nitrogen fixation through reduced root nodule formation on alfalfa. Ecotoxicology, 28(6), 599– 611. https://doi.org/10.1007/ s1064 6- 019- 02047 - 9
Sheppard, S. C., Grant, C. A., Sheppard, M. I., de Jong, R., & Long, J. (2009). Risk indicator for agricultural inputs of trace elements to Canadian soils. Journal of Environmental Quality, 38(3), 919– 932. https://doi.org/10.2134/jeq20 08.0195
Takizawa, S., Kurisu, F., & Satoh, H. (2009). Southeast Asian water environment 3 (Vol 8). IWA Publishing. https://books.google. co.nz/books ?id=6pahU cse7TcC.
Taylor, M., Kim, N., Smidt, G., McNally, S., Robinson, B., Kratz, S., & Schnug, E. (2016). Trace element contaminants and radioactivity from phosphate fertiliser. In E. Schnug & L. J. De Kok (Eds.), Phosphorus in agriculture: 100% zero (pp. 231– 266). Springer. https://doi.org/10.1007/978- 94- 017- 7612- 7_12
Taylor, M. D., & Kim, N. D. (2009). Dealumination as a mechanism for increased acid recoverable aluminium in Waikato mineral soils. Australian Journal of Soil Research, 47, 828– 838. https:// doi.org/10.1071/SR09053
Taylor, M. D., Kim, N. D., Briggs, R. M., Taylor, A., & Guinto, D. F. (2012). An investigation into the process of dealumination in soils of the Auckland, Bay of Plenty and Waikato regions of New Zealand. Applied Clay Science, 64, 18– 24. https://doi. org/10.1016/j.clay.2012.06.008
Thompson- Morrison, H., Gaw, S., Ariantiningsih, F., Arief, S. M., & Robinson, B. (2022a). Chemical elements in soils from current and former palm oil production systems. [paper in press].
Thompson- Morrison, H., Gaw, S., Ariantiningsih, F., Arief, S. M., & Robinson, B. (2022b). Chemical elements in plants and oils from current and former palm oil production systems. [paper in press].
Tóth, G., Hermann, T., Da Silva, M. R., & Montanarella, L. (2016, 2016/03/01/). Heavy metals in agricultural soils of the European Union with implications for food safety. Environment International, 88, 299– 309. https://doi.org/10.1016/j. envint.2015.12.017
USDA. (1999). Soil taxonomy: A basic system of soil classification for making and interpreting soil surveys (2nd ed.). USDA.
USEPA. (1999). Understanding variation in partition coefficient, Kd, values. Volume II: Review of geochemistry and available Kd values for cadmium, cesium, chromium, lead, plutonium, radon, strontium, thorium, tritium (3H), and uranium (EPA 402- R- 99- 004B).
Vijay, V., Pimm, S. L., Jenkins, C. N., & Smith, S. J. (2016). The impacts of oil palm on recent deforestation and biodiversity loss. PLoS One, 11(7), e0159668. https://doi.org/10.1371/journ al.pone.0159668
Wairich, A., De Conti, L., Lamb, T. I., Keil, R., Neves, L. O., Brunetto, G., Sperotto, R. A., & Ricachenevsky, F. K. (2022). Throwing

copper around: How plants control uptake, distribution, and accumulation of copper. Agronomy, 12(994), 1– 29. https://doi. org/10.3390/agron omy12 050994
Wania, F., & Mackay, D. (1999). The evolution of mass balance models of persistent organic pollutant fate in the environment. Environmental Pollution, 100(1– 3), 223– 240. https://doi. org/10.1016/s0269 - 7491(99)00093 - 7
Wasis, B. (2012). Soil properties in natural forest destruction and conversion to agricultural land. Gunung Leuser National Park, North Sumatera Province, 18(3), 206– 212. https://doi. org/10.7226/jtfm.18.3.206
Woittiez, L. S., Slingerland, M., & Giller, K. E. (2015). Yield gaps in Indonesian smallholder plantations: Causes and solutions international palm oil congress and exhibition. Kuala Lumpur.
Woittiez, L. S., Slingerland, M., Rafik, R., & Giller, K. E. (2018). Nutritional imbalance in smallholder oil palm plantations in Indonesia. Nutrient Cycling in Agroecosystems, 111, 73– 86. https://doi.org/10.1007/s1070 5- 018- 9919- 5
12SUPPORTING INFORMATION支持信息
Additional supporting information can be found online in the Supporting Information section at the end of this article.
其他支持信息可在本文末尾的“支持信息”部分在线获取。
How to cite this article: Thompson- Morrison, H., Moltchanova, E., Gaw, S., & Robinson, B. (2024). Development and use of a mass- balance model to calculate the likely effects of agrichemicals on trace element accumulation in soils supporting palm oil production. Soil Use and Management, 40, e12935. https://doi.org/10.1111/sum.12935
引用本文:Thompson- Morrison, H., Moltchanova, E., Gaw, S., & Robinson, B. (2024). Development and use of a mass- balance model to calculate the likely effects of agrichemicals on trace element accumulation in soils supporting palm oil production. Soil Use and Management, 40, e12935. https://doi.org/10.1111/sum.12935