Contents lists available at ScienceDirect journal homepage: www.sciencedirect.com/journal/cleaner-water
Coral sands as potential low cost treatment for removing fluoride from drinking water
M.H. Lecompte a,*,1, B. Robinson b, S. Gaw b
a Waterways Centre, University of Canterbury, Private Bag 4800, Christchurch 8140, New Zealand b School of Physical & Chemical Sciences, University of Canterbury, Private Bag 4800, Christchurch 8140, New Zealand
A B S T R A C T
Fluoride (F-) toxicity from contaminated drinking water affects over 200 million people worldwide. While defluoridation with adsorbents such as calcium carbonate, is commonly used, most technologies are unsuitable for resource-constrained areas. Coral sand is readily available in tropical regions but is yet to be investigated as a potential F- adsorbent. The effectiveness of coral sand at removing F- from drinking water was assessed using acid-enhanced lime defluoridation with two beach (Kiribati and Vanuatu) and one commercially available coral sands. Citric acid was selected as it is readily accessible, palatable and safe for human consumption. Mini columns with a 5:1 sand-to-fluid ratio, 0.025 M citric acid and a 4-hour residence time, could be used seven times to reduce F- from 10 mg/L to below the World Health Organization (WHO) guideline value of 1.5 mg/L. Mini columns packed with coarser grained (1.3 mm) Vanuatu sand could be used at least 10 times. Increasing citric acid to 0.050 M reduced removal efficiency. Prototype treatment devices, developed using 1 L polyethylene jerrycans and 1 kg of commercial sand, could only be used a maximum of three times with 0.025 M citric acid. All coral sands contained F- as well as other trace elements of human health concern, including As, B, Cr, Mn, and Ni that were released into the treated water, resulting in exceedances of drinking water standards. Total Cr concentrations in treated water always exceeded the 0.05 mg/L WHO health guideline whereas As exceeded the 0.01 mg/L value in the majority of treated water samples. In addition, B, Na, and Ni concentrations exceeded the WHO guidelines in many water samples treated with Kiribati and Vanuatu sands. Treated water samples were also unpalatable as potable water based on hardness, total dissolved solids and elevated concentrations of Al, Fe, and Mn. It is recommended that drinking water treated with coral sand be analysed for the presence of contaminants of health concern.
受污染饮用水导致的氟化物(F-)毒性影响着全球超过2亿人。尽管利用碳酸钙等吸附剂进行除氟的方法已被广泛采用,但大多数技术并不适用于资源匮乏地区。珊瑚砂在热带地区易于获得,但其作为潜在F-吸附剂的性能尚未得到研究。本研究采用酸强化石灰除氟法,以两种海滩珊瑚砂(基里巴斯和瓦努阿图)和一种市售珊瑚砂为材料,评估了珊瑚砂去除饮用水中F-的效果。选用柠檬酸是因为其易于获取、口感可接受且可安全供人食用。采用砂液比为5:1、柠檬酸浓度为0.025 M、停留时间为4小时的微型柱,可重复使用7次,将F-由10 mg/L降至世界卫生组织(WHO)准则值1.5 mg/L以下。装填较粗颗粒(1.3 mm)瓦努阿图砂的微型柱至少可使用10次。将柠檬酸浓度提高至0.050 M反而降低了去除效率。以1 L聚乙烯塑料桶和1 kg市售砂制成的原型处理装置,在0.025 M柠檬酸条件下最多仅能使用3次。所有珊瑚砂均含有F-以及其他危害人体健康的微量元素,包括As、B、Cr、Mn和Ni,这些元素会释放到处理后的水中,导致超出饮用水标准。处理后水中的总Cr浓度始终超过WHO 0.05 mg/L的健康准则值,而大多数处理后水样中的As超过0.01 mg/L的准则值。此外,在许多经基里巴斯砂和瓦努阿图砂处理的水样中,B、Na和Ni浓度超过WHO准则值。基于硬度、总溶解性固体以及Al、Fe和Mn浓度偏高,处理后的水样作为饮用水在感官上亦不可接受。建议对经珊瑚砂处理的饮用水进行健康相关污染物的检测。
1Introduction引言
Excess fluoride (F-) in drinking water is a global public health issue. Fluoride present within volcanic ash, geothermal fluids, and clay minerals derived from fluorspar (CaF2), fluorapatite ([3Ca3(PO4)2Ca(FCl2)], cryolite (Na3AlF6) and sellaite (MgF2), is released into soil pore water, which eventually enters drinking water (Alarcon-Herrera et al., 2013; ´ Ayoob and Gupta, 2006; Cronin et al., 2003; Mohapatra et al., 2009; Saxena, 2018). Chronic consumption of excess F-mainly occurs through ingesting food and water with elevated F-concentrations, leading to fluorosis, a condition of brittle teeth and bones (Ayoob and Gupta, 2006; Allibone et al., 2012; World Health Organization., 2004; Kimambo et al., 2019). Over 200 million people are affected worldwide (Ayoob and Gupta, 2006) and the issue is particularly prevalent in low socio-economic groups (Levy, 2005), rural communities lacking central treatment systems (Kimambo et al., 2019) and areas with volcanic activity (D’Alessandro, 2006).
饮用水中氟化物(F-)过量是一个全球性的公共卫生问题。火山灰、地热流体以及由萤石(CaF2)、氟磷灰石([3Ca3(PO4)2Ca(FCl2)])、冰晶石(Na3AlF6)和氟镁石(MgF2)衍生的黏土矿物中所含的氟化物会释放到土壤孔隙水中,并最终进入饮用水(Alarcon-Herrera et al., 2013; ´ Ayoob and Gupta, 2006; Cronin et al., 2003; Mohapatra et al., 2009; Saxena, 2018)。长期过量摄入F-主要源于食用F-浓度偏高的食物和饮水,进而导致氟中毒,即牙齿和骨骼变脆的病症(Ayoob and Gupta, 2006; Allibone et al., 2012; World Health Organization., 2004; Kimambo et al., 2019)。全球受影响人口超过2亿(Ayoob and Gupta, 2006),该问题在低社会经济群体(Levy, 2005)、缺乏集中处理系统的农村社区(Kimambo et al., 2019)以及火山活动地区(D’Alessandro, 2006)尤为普遍。
Where alternate water sources and better nutrition are unavailable, defluoridation of drinking water is the only viable solution (Kimambo et al., 2019; Keesari et al., 2019; Meenakshi and Maheshwari, 2006). It is mainly achieved by precipitation / coagulation, absorption, membrane technologies, or electrochemical techniques (Kimambo et al., 2019; Fan, 2003; Mohapatra et al., 2009; Yadav et al., 2018), however, such technologies are complex and costly. Precipitation is generally used for highly concentrated solutions but can only reduce concentrations to about 2 mg/L (Fan, 2003; Wang and Reardon, 2001; Yang et al., 1999; Nath and Dutta, 2010a). Fluoride may be precipitated with aluminium salt but a toxic sludge is generated (Nath and Dutta, 2010b). Sorption is more effective than precipitation at reducing F-concentrations to 1 mg/L (Reardon and Wang, 2000) and is controlled by properties of the adsorbent and the physico-chemical conditions of the solution. It requires: 1) diffusion of F-to the external surface of the adsorbent (i.e. mass transport); 2) adsorption onto the adsorbent surface; and 3) diffusion into the inner surfaces of the material (Fan, 2003). Studies have demonstrated the effectiveness of calcium carbonate materials, which are abundantly available in various forms such as lime or hydroxyapatite, at F-removal from drinking water (Vijayeeswarri et al., 2019). Though adsorption has advantages over other methods including effectiveness, low-cost, potential for reuse, availability of numerous adsorbents, and simple operation process and design (Mohapatra et al., 2009; Yadav et al., 2018; Kanaujia et al., 2015; Vinati et al., 2015), research is on-going as no material has been fully successful in resource constrained rural regions (Cherukumilli et al., 2018).
在无法获得替代水源和更好营养的情况下,饮用水除氟是唯一可行的解决方案(Kimambo et al., 2019; Keesari et al., 2019; Meenakshi and Maheshwari, 2006)。除氟主要通过沉淀/混凝、吸附、膜技术或电化学技术实现(Kimambo et al., 2019; Fan, 2003; Mohapatra et al., 2009; Yadav et al., 2018),但这些技术复杂且成本高昂。沉淀法通常用于高浓度溶液,但仅能将浓度降至约2 mg/L(Fan, 2003; Wang and Reardon, 2001; Yang et al., 1999; Nath and Dutta, 2010a)。氟化物可用铝盐沉淀,但会产生有毒污泥(Nath and Dutta, 2010b)。在将F-浓度降至1 mg/L方面,吸附法比沉淀法更为有效(Reardon and Wang, 2000),其效果受吸附剂性质和溶液理化条件的控制。吸附过程包括:1)F-向吸附剂外表面扩散(即传质);2)在吸附剂表面发生吸附;3)向材料内表面扩散(Fan, 2003)。研究表明,以石灰或羟基磷灰石等多种形式大量存在的碳酸钙材料能够有效去除饮用水中的F-(Vijayeeswarri et al., 2019)。尽管吸附法相较于其他方法具有高效、低成本、可重复使用、可选吸附剂众多以及操作流程和设计简单等优点(Mohapatra et al., 2009; Yadav et al., 2018; Kanaujia et al., 2015; Vinati et al., 2015),但由于尚无一种材料在资源匮乏的农村地区完全取得成功,相关研究仍在进行中(Cherukumilli et al., 2018)。
* Corresponding author.
E-mail addresses: mhlecompte@gmail.com (M.H. Lecompte), brett.robinson@canterbury.ac.nz, brett.robinson@kiwiscience.com (B. Robinson), sally.gaw@ canterbury.ac.nz (S. Gaw).
1Present address: Institute of Environmental Science and Research (ESR) 27 Creyke Road Ilam Canterbury 8041. New Zealand
1现地址:Institute of Environmental Science and Research (ESR),27 Creyke Road,Ilam,坎特伯雷 8041,新西兰
https://doi.org/10.1016/j.clwat.2024.100025
https://doi.org/10.1016/j.clwat.2024.100025
Received 27 April 2024; Received in revised form 11 June 2024; Accepted 20 June 2024 Available online 21 June 2024
2950-2632/© 2024 The Authors. Published by Elsevier Ltd. This is an open access article under the CC BY license (http://creativecommons.org/licenses/by/4.0/).
2950-2632/© 2024 作者。由Elsevier Ltd.出版。本文为依据CC BY许可协议(http://creativecommons.org/licenses/by/4.0/)发布的开放获取文章。
In calcite systems, both adsorption and precipitation occurs (Nath and Dutta, 2010a; Turner et al., 2005), which enables F-removal in low concentrated solutions (Nath and Dutta, 2012), essential for generating safe drinking water. The reaction is heavily pH dependent (Yadav et al., 2018; Turner et al., 2005). Low pH in acid-enhanced lime defluoridation (AELD) increases calcium ion concentration in solution available for CaF precipitation (Nath and Dutta, 2010b; Gogoi and Dutta, 2016a) and protonates the adsorbent which increases its electrostatic attraction to F- (Yadav et al., 2018). Edible acids (phosphoric, acetic and citric) are generally preferred and citric acid was used herein due to enhanced safety and accessibility.
在方解石体系中,吸附与沉淀同时发生(Nath and Dutta, 2010a; Turner et al., 2005),从而能够去除低浓度溶液中的F-(Nath and Dutta, 2012),这对于获得安全饮用水至关重要。该反应高度依赖pH(Yadav et al., 2018; Turner et al., 2005)。在酸强化石灰除氟(AELD)中,低pH可提高溶液中可用于CaF沉淀的钙离子浓度(Nath and Dutta, 2010b; Gogoi and Dutta, 2016a),并使吸附剂质子化,从而增强其对F-的静电吸引(Yadav et al., 2018)。食用酸(磷酸、乙酸和柠檬酸)通常为首选,鉴于柠檬酸安全性更高且易于获取,本研究采用柠檬酸。
Coral sand, a calcium carbonate material from coral reefs, is abundant between the latitudes of 30◦N and 30◦S and readily available in the Pacific Region where volcanic and geothermal activity are prevalent and consequentially, elevated F-concentrations are common (Cronin et al., 2003; Allibone et al., 2012; Mallik, 1999). Given prior successes at F- removal using limestone and the use of coral sand as a filtering medium for pathogen removal (Burbery et al., 2015; Humphries et al., 2016), we hypothesised that this material may also be a low-cost solution to remedy F-contaminated drinking water. We aimed to utilise coral sand to develop low-cost water treatment devices to remove F-from household drinking water. Specifically, we sought to determine: 1) the ability of coral sand to reduce F-concentration in water using a filtration system, 2) the number of times the system could be reused before losing efficiency, and 3) the safety of treated water according to the World Health Organisation (World Health Organization, 2017) drinking water guidelines.
珊瑚砂是一种源自珊瑚礁的碳酸钙材料,在北纬30◦至南纬30◦之间储量丰富,在太平洋地区易于获得;该地区火山和地热活动频繁,因而F-浓度偏高的现象十分常见(Cronin et al., 2003; Allibone et al., 2012; Mallik, 1999)。鉴于此前利用石灰石去除F-取得的成功,以及珊瑚砂作为过滤介质用于去除病原体的应用(Burbery et al., 2015; Humphries et al., 2016),我们假设该材料亦可作为修复F-污染饮用水的低成本方案。本研究旨在利用珊瑚砂开发低成本水处理装置,以去除家庭饮用水中的F-。具体而言,我们试图确定:1)珊瑚砂在过滤系统中降低水中F-浓度的能力;2)该系统在效率下降前可重复使用的次数;3)依据世界卫生组织(World Health Organization, 2017)饮用水准则评估处理后水的安全性。
2Materials and methods材料与方法
2.1. Materials2.1. 材料
Two grades of ‘Natural Colour’ coral sands (0.8–1.0 and 1–2 mm) were purchased from Living Reef (livingreef.co.nz). Coral sands were obtained from Bikenibeu beach, South Tarawa, Kiribati (1.367◦N, 173.126◦ E) and Port Villa, Vanuatu (17.44◦S, 168.18◦E). Large particles were removed and the sand was oven dried at 60–65 ◦C for a minimum of 24 hours prior to use.
两种粒级(0.8–1.0 mm和1–2 mm)的“Natural Colour”珊瑚砂购自Living Reef(livingreef.co.nz)。另从基里巴斯南塔拉瓦Bikenibeu海滩(1.367◦N,173.126◦ E)和瓦努阿图维拉港(17.44◦S,168.18◦E)采集珊瑚砂。使用前去除大颗粒,并将砂样在60–65 ◦C下烘干至少24小时。
Plasticware was obtained from Stowers Containment Solutions (stower.co.nz). All chemicals used were analytical grade (≥ 99 % purity) with the exception of ‘VALUE’ brand food-grade citric acid purchased from a supermarket. Sodium fluoride (NaF) was oven dried at 60 ◦C for a minimum of 8 hours and stored in a dessicator until use. Solutions and reagents were made using ultrapure water (< 18.2 MΩ.cm).
塑料器皿购自Stowers Containment Solutions(stower.co.nz)。除从超市购买的“VALUE”牌食品级柠檬酸外,所用化学试剂均为分析纯(纯度≥ 99 %)。氟化钠(NaF)在60 ◦C下烘干至少8小时,并储存于干燥器中备用。溶液和试剂均用超纯水(< 18.2 MΩ.cm)配制。
Stock F-solutions and calibration standards (0.25, 0.5, 2, 5, 10, 15 and 25 mg/L) were prepared gravimetrically. Laboratory control (LCS) and calibration curve verification (CCV) samples were prepared from a second batch of NaF. The Fluoride Standard for Ion Chromatography (1 g/L) was diluted to make spike solutions of 50, 100, 200, and 250 mg/L. Total ionic strength adjustment buffer (TISAB) was prepared from of 0.05 M disodium EDTA dihydrate, 1 M sodium chloride, 0.5 M glacial acetic acid and the pH was adjusted between 5 and 5.5 with NaOH.
F-储备液和校准标准溶液(0.25、0.5、2、5、10、15和25 mg/L)采用重量法配制。实验室控制样(LCS)和校准曲线核查样(CCV)由另一批次的NaF配制。将离子色谱用氟化物标准溶液(1 g/L)稀释,配制成50、100、200和250 mg/L的加标溶液。总离子强度调节缓冲液(TISAB)由0.05 M乙二胺四乙酸二钠二水合物、1 M氯化钠和0.5 M冰乙酸配制,并用NaOH将pH调至5–5.5之间。
2.2. Particle density and size distribution2.2. 颗粒密度与粒径分布
The particle density of each sand type was determined according to the method described by Sarkar (Sarkar and Haldar, 2005). The particle size distribution (PSD) was determined by sieving according to the Wentworth (Wentworth, 1922) Scale classification and used to calculate mean particle size (refer supplementary data).
各类砂的颗粒密度按照Sarkar所述方法(Sarkar and Haldar, 2005)测定。粒径分布(PSD)依据Wentworth(Wentworth, 1922)粒级分类通过筛分法测定,并据此计算平均粒径(参见补充数据)。
Characteristics of the coral sands used in this study.
本研究所用珊瑚砂的特性。
| Characteristics特性 | Commerci市售 | al Sands砂 | Pacific Be太平洋海 | i ach Sands滩砂 | |
|---|---|---|---|---|---|
| (Average± 2 SD) | Fine | Coarse | Kiribati | Vanuatu | |
| (0.8–1 mm) | (1–2 mm) | ||||
| Particle size distrib | ution | Wentworth | scale (% w/w | ) (Wentworth | , 1922) |
| Sieve Diameter | 4+ | — | — | * | * |
| (mm) | removed | removed | |||
| 2 | 0±0 | 0.04± 0.1 | 0.105 | * removed | |
| 1 | 25± 5 | 0.6± 0.2 | 76.9 | 7.53 | |
| 0.5 | 64± 2 | 47± 2 | 22.5 | 46.7 | |
| 0.25 | 10± 5 | 48± 2 | 0.488 | 35.1 | |
| 0.125 | 0.4±0.3 | 4.1± 0.2 | 0.035 | 10.6 | |
| 0.063 | 0.07± 0.1 | 0.18± 0.03 | 0 | 0.059 | |
| _<_0.063 | 0.02±0.04 | 0.058± 0.003 | 0 | 0 | |
| Mean particle size | (mm) | 0.55±0.01 | 0.90± | 0.615 | 1.327 |
| (n=3) | 0.03 (n=3) | (n=1) | (n=1) | ||
| Particle density (g/ n=4) | cm3, | 2.82±0.06 | 2.81± 0.02 | 2.78± 0.01 | 2.81± 0.03 |
| Mineral compositio | n | 72:28± 4 | 68:32± 4 | 44:56± | 49:51± |
| Aragonite: Calcit weight) | e (% | 1 | 8 | ||
| Elemental | O: | 45± 2 | Not done | 46±1 | 44± 10 |
| composition | Ca: | 32± 2 | 29±2 | 26± 13 | |
| (% weight) | C: | 20± 1 | 22±3 | 25± 10 | |
| Mg: | 1±3 | 2±3 | 1± 1 |
* Sand had been sieved prior to experimental trials. Mineral composition by X-ray Powder Diffraction, n=2 (n=4 for Vanuatu). Elemental composition by Scanning Electron Microscopy-Energy Dispersive X-Ray Spectroscopy (n=3).
* 砂样在试验前已过筛。矿物组成采用X射线粉末衍射测定,n=2(瓦努阿图砂n=4)。元素组成采用扫描电子显微镜-能谱仪测定(n=3)。
2.3. Scanning Electron Microscopy (SEM-EDX)2.3. 扫描电子显微镜(SEM-EDX)
Triplicate samples of each sand type were carbon-coated using an EMS150T ES Quorum Carbon Coater and imaged (down to 1500 X) with backscatter and secondary electron detection using a JEOL JSM-IT300 EMS-SEM.
每种砂取三个平行样,使用EMS150T ES Quorum碳镀膜仪进行喷碳处理,并采用JEOL JSM-IT300 EMS-SEM以背散射电子和二次电子检测模式成像(最高1500 X)。
2.4. X-ray diffraction (XRD)2.4. X射线衍射(XRD)
Duplicate 1–2 g portions of dried untreated sand were ground using a mortar and pestle. Samples were mounted as a 0.5 mm layer on glass slides. Scans were made in 1D mode using a D-Tex detector from 5 – 65 ◦ at 5 ◦/min using a Cu Kβ filter and 5 ◦ soller slits. Data were processed on the Rigaku PDXL2 software, subtracting a polynomial background and calculating the relative amounts of phases using the RIR method. The ICDD (PDF4+ 2021) library was used for compound search.
取两份1–2 g未经处理的干燥砂样,用研钵研磨。样品以0.5 mm厚的薄层装载于玻璃载片上。采用D-Tex探测器以1D模式扫描,扫描范围为5 – 65 ◦,扫描速率为5 ◦/min,使用Cu Kβ滤光片和5 ◦索拉狭缝。数据使用Rigaku PDXL2软件处理,扣除多项式背景,并采用RIR法计算各物相的相对含量。化合物检索采用ICDD(PDF4+ 2021)数据库。
2.5. Sand characterisation2.5. 砂的表征
The composition and particle size distribution of the sands used are listed in Table 1. SEM micrograms (refer Results) confirmed the high micro-porosity and surface area available for sorption of the coral sand, supporting its choice as a potentially good adsorbent.
所用砂的组成和粒径分布列于表1。SEM显微图像(参见结果部分)证实珊瑚砂具有较高的微孔隙度和可供吸附的比表面积,支持其作为潜在优良吸附剂的选择。
2.6. Reactor preparation and experimental design2.6. 反应器制备与试验设计
The experimental design conducted herein was in part modelled on published AELD studies conducted on limestone using various acids (Nath and Dutta, 2010a, 2010b, 2012; Gogoi and Dutta, 2016a). Preliminary trials conducted by the authors indicated high sand-to-fluid ratios were more effective at F-removal as was moderate (0.025 or 0.050 M) citric acid concentrations and no remarkable improvements were noted by increasing contact time from four to eight hours (data not shown). An initial F-concentration of 10 mg/L was selected as concentrations of F-in drinking water sources in volcanic areas can exceed 4–5 mg/L (Rubio et al., 2020; Cordeiro et al., 2012).
本研究的试验设计部分参照了已发表的以石灰石和多种酸开展的AELD研究(Nath and Dutta, 2010a, 2010b, 2012; Gogoi and Dutta, 2016a)。作者开展的预试验表明,较高的砂液比和中等浓度(0.025或0.050 M)的柠檬酸对F-的去除更为有效,而将接触时间由4小时延长至8小时并未带来显著改善(数据未列出)。选择10 mg/L作为初始F-浓度,是因为火山地区饮用水源中的F-浓度可超过4–5 mg/L(Rubio et al., 2020; Cordeiro et al., 2012)。
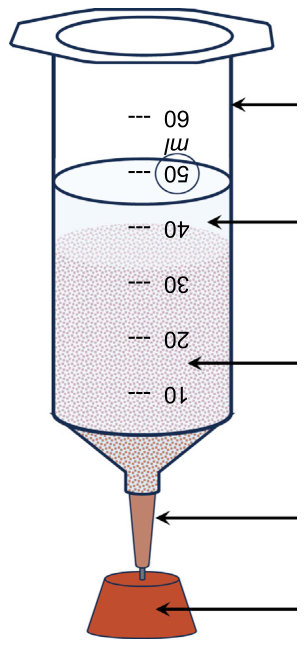
Sand mini columns: The mini columns prepared from a Thermo Fisher Scientific 50 mL polypropylene syringe body and a 26-gauge needle were inserted into a rubber bung to impede fluid loss (Fig. 1). Initial solutions of 10.0 ± 0.2 mg/L (F-) with 0.050 M or 0.025 M (± 4 %) citric acid were made daily, from a 1:1 dilution of stock 20.0 mg F-/L solution and 0.10 M or 0.050 M citric acid, respectively. To test F-removal, triplicate mini columns with 75 g of sand were filled with 25 mL of initial solution, equating to a sand-to-fluid ratio of 3:1. These were left to stand at room temperature for four hours prior to collecting the treated water. For subsequent refills, 15 mL of fluoride solution was added (5:1 ratio) to the top of the syringe as some water remained in the mini column. Mini columns were tested twice daily (morning and midday) to replicate use within a household, until F-concentrations in the treated water exceeded 1.5 mg/L. A single, mini column with no sand was also processed with initial solution as a control.
砂微型柱:微型柱由Thermo Fisher Scientific 50 mL聚丙烯注射器筒体和26号针头制成,并插入橡胶塞中以防止液体流失(图1)。每日配制F-浓度为10.0 ± 0.2 mg/L、柠檬酸浓度为0.050 M或0.025 M(± 4 %)的初始溶液,分别由20.0 mg F-/L储备液与0.10 M或0.050 M柠檬酸按1:1稀释而成。为测试F-去除效果,在装有75 g砂的三个平行微型柱中加入25 mL初始溶液,即砂液比为3:1。在室温下静置4小时后收集处理后的水。由于微型柱中仍残留部分水,后续每次补充时向注射器顶部加入15 mL氟化物溶液(比例为5:1)。为模拟家庭使用情形,微型柱每日测试两次(上午和中午),直至处理后水中F-浓度超过1.5 mg/L。另设一根不含砂的微型柱,以初始溶液处理作为对照。
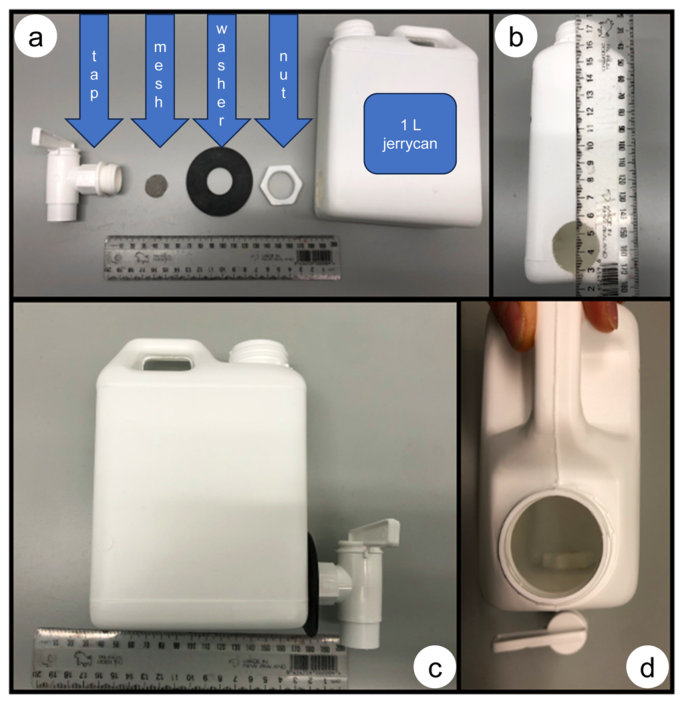
Prototypes with fine & coarse commercial sand: Pilot treatment devices were prepared from 1 L high density polyethylene jerrycan by inserting a ¾ inch BSP tap and back nut, through a hole approximately 0.7–1.0 cm from the bottom of the jerrycan (Fig. 2). Metal mesh of approximately 150–200 μm size was placed inside the tap and a ‘Fix-a-loo’ washer (fixatap.com.au) fitted to the exterior. Prototypes were thoroughly soaked and rinsed with dH2O and ultrapure water prior to use. Triplicate prototypes containing 1000 g of commercial sand were loaded and emptied twice daily (morning and midday) with the same sand-to-fluid ratio as per the mini columns (i.e. 333.3 mL ± 0.5 % of initial solution containing 10.0 mg F-/L and 0.025 M food-grade citric acid; 200 mL in subsequent fillings). The experiment was conducted with fine and coarse commercial sand. A single replicate with fine commercial sand was also processed as above using analytical grade citric acid (as opposed to food-grade). A single, no acid prototype was run alongside and a blank (no sand) prototype was also processed on day 1. Samples of the initial solutions were also analysed.
装填细粒与粗粒市售砂的原型装置:试验处理装置由1 L高密度聚乙烯塑料桶制成,在距桶底约0.7–1.0 cm处开孔,插入¾英寸BSP水龙头及背螺母(图2)。在水龙头内部放置孔径约150–200 μm的金属网,并在外侧安装“Fix-a-loo”垫圈(fixatap.com.au)。原型装置在使用前用dH2O和超纯水充分浸泡并冲洗。三个平行原型装置各装入1000 g市售砂,每日装液和排液两次(上午和中午),砂液比与微型柱相同(即首次加入333.3 mL ± 0.5 %含10.0 mg F-/L和0.025 M食品级柠檬酸的初始溶液;后续每次加入200 mL)。试验分别使用细粒和粗粒市售砂进行。另设一个装填细粒市售砂的单一重复,按上述方法处理,但使用分析纯柠檬酸(而非食品级)。同时运行一个不加酸的原型装置,并在第1天处理一个空白(无砂)原型装置。初始溶液样品亦进行了分析。
Sample collection and processing: Treated water was extracted by gravity by removing the needle assembly from mini columns or tilting prototypes at an angle of roughly 30 degrees into polystyrene 25 mL vials or 250 mL jars, respectively. The extracted treated water was homogenised and subsamples syringe-filtered (0.2 µm Ahlstrom Reliaprep™). Electrical conductivity of water treated with prototype devices was measured using a Hach HQ440d multimeter with a CDC401 conductivity probe and converted to estimated total dissolved solids (TDS) according to Eq. (1) (Taylor et al., 2018).
样品采集与处理:处理后的水通过重力排出:对于微型柱,拆除针头组件;对于原型装置,将其倾斜约30度,分别收集于25 mL聚苯乙烯小瓶或250 mL广口瓶中。将排出的处理后水混匀,取子样经注射器过滤(0.2 µm Ahlstrom Reliaprep™)。经原型装置处理的水的电导率采用配有CDC401电导率探头的Hach HQ440d多参数仪测定,并按式(1)换算为总溶解性固体(TDS)估算值(Taylor et al., 2018)。
TDS = CF x EC (1)
TDS = CF x EC (1)
Where,式中,
EC = Electrical conductivity readings (μS/cm),
EC = 电导率读数(μS/cm),
TDS = Total dissolved solids in mg/L,
TDS = 总溶解性固体(mg/L),
CF = conversion factor (0.64) for high salinity samples (HACH, 2021).
CF = 高盐度样品的换算系数(0.64)(HACH, 2021)。
2.7. FISE methodology and analysis2.7. 氟离子选择电极(FISE)方法与分析
A calibration curve was prepared daily using standards diluted 1:1 with TISAB. The measured potential was entered into Excel to calculate the slope (S), intercept (E0) and R value. Curves were deemed acceptable if: R Value ≥ 0.999; slope within − 54 to − 59; and standards within 10 % of prepared value.
每日用经TISAB按1:1稀释的标准溶液绘制校准曲线。将测得的电位输入Excel,计算斜率(S)、截距(E0)和R值。校准曲线的可接受标准为:R值≥ 0.999;斜率在− 54至− 59之间;标准溶液测定值与配制值偏差在10 %以内。
For the filtered treated water samples, 2.5 mL was diluted 1:1 with TISAB and decomplexed for a minimum of 30 minutes. The pH was adjusted between 5.0 and 5.5 with 10 M NaOH as required and the electrode potential measured according to manufacturer recommendations (EDT, 2021) and ASTM standard (American Society for Testing and Materials International, 2016). Sample potential (E, in mV) was converted to F-concentration in mg F-/L based on the Nernst equation (International Organization for Standardization, 1992), according to Eq. (2):
对于过滤后的处理水样,取2.5 mL与TISAB按1:1稀释,并解络合至少30分钟。必要时用10 M NaOH将pH调至5.0–5.5之间,按照制造商建议(EDT, 2021)和ASTM标准(American Society for Testing and Materials International, 2016)测定电极电位。基于能斯特方程(International Organization for Standardization, 1992),按式(2)将样品电位(E,mV)换算为F-浓度(mg F-/L):
[F-] = 0.18998 ×10 (E-E0)/S

Duplicates were ≤ 6 % different for F-concentrations above 0.5 mg/ L and ≤ 15 % for concentrations below 0.5 mg/L. Laboratory control samples were ≤ 15 % error. Ultrapure water was used as a reagent blank. A matrix spike and comparative standard (i.e. spiked reagent blank) was performed on one replicate per treatment type and the percent recovery (P) calculated according to Eq. 1 in the standard test method for fluoride (American Society for Testing and Materials International, 2016). The standardised percent recovery (P’) of the spiked sample was calculated as per Eq. 3:
对于F-浓度高于0.5 mg/ L的样品,平行样相对偏差≤ 6 %;浓度低于0.5 mg/L的样品,相对偏差≤ 15 %。实验室控制样误差≤ 15 %。以超纯水作为试剂空白。每种处理类型选取一个重复进行基质加标和对照标准(即加标试剂空白)测定,并按照氟化物标准测试方法(American Society for Testing and Materials International, 2016)中的式1计算回收率(P)。加标样品的标准化回收率(P’)按式3计算:
P’ = 100 x Psp / Pstn (3)
Where,
Pstn = Percent recovery of the comparative standard, Psp = Percent recovery of the spiked sample.
Pstn = 对照标准的回收率,Psp = 加标样品的回收率。
To improve analytical results for samples where matrix interference was identified (i.e. P’ outside the 80–120 % range), dilute FISE samples prepared from 1.25 mL treated water, 1.25 mL ultrapure water, and 2.5 mL TISAB were analysed as necessary (i.e. until P’ of non-dilute FISE samples > 85 %). Additional details regarding the method performance is included in the supplementary data.
为改善存在基质干扰(即P’超出80–120 %范围)样品的分析结果,必要时分析由1.25 mL处理后水、1.25 mL超纯水和2.5 mL TISAB配制的稀释FISE样品(即直至未稀释FISE样品的P’ > 85 %)。有关方法性能的更多细节见补充数据。
Method 3051 A (United States Environmental Protection Agency, 2007), along with two reagent blanks and a Certified Marine Sediment 2702 reference material (National Institute of Standards and Technology, 2019). The recoveries for trace elements were acceptable (refer Table 4). The treated water samples and sand digests were diluted with 2 % HNO3 for trace element analysis (Al27, As75&75–91, B11, Ca44, Cr52, Cu63, Fe56–72, Mg24, Mn55, Na23, and Ni60) by ICP-MS/MS (Agilent 8900) using He as a collision gas and O2 as a reaction gas with Rh added online as an internal standard. Recoveries for relevant elements from the Trace Elements in Water Certified Reference Material (CRM) run daily measured between 85 – 115 % of reported values (National Institute of Standards and Technology, 2015). Trace element concentrations from initial solutions or blank columns/prototypes, whichever was highest, were deducted from the treated water samples concentrations and the control-deducted concentrations reported herein.
方法3051 A(United States Environmental Protection Agency, 2007)进行酸消解,同时消解两个试剂空白和一个海洋沉积物有证标准物质2702(National Institute of Standards and Technology, 2019)。微量元素回收率均可接受(参见表4)。处理后水样和砂消解液用2 % HNO3稀释后进行微量元素分析(Al27、As75&75–91、B11、Ca44、Cr52、Cu63、Fe56–72、Mg24、Mn55、Na23和Ni60),采用ICP-MS/MS(Agilent 8900)测定,以He为碰撞气、O2为反应气,并在线加入Rh作为内标。每日测定的水中微量元素有证标准物质(CRM)中相关元素的回收率为标称值的85 – 115 %(National Institute of Standards and Technology, 2015)。从处理后水样浓度中扣除初始溶液或空白柱/空白原型装置中微量元素浓度的较高者,本文报告的均为扣除对照后的浓度。
3Results and discussion结果与讨论
2.8. Trace elements in treated water and coral sands2.8. 处理后水和珊瑚砂中的微量元素
Aliquots of filtered treated water were acidified with concentrated HNO3 to pH <2 and refrigerated until analysis. Triplicate sand samples were acid digested in a microwave digestion system according to
过滤后的处理水样分取部分,用浓HNO3酸化至pH <2,冷藏保存至分析。砂样取三个平行样,在微波消解系统中按照
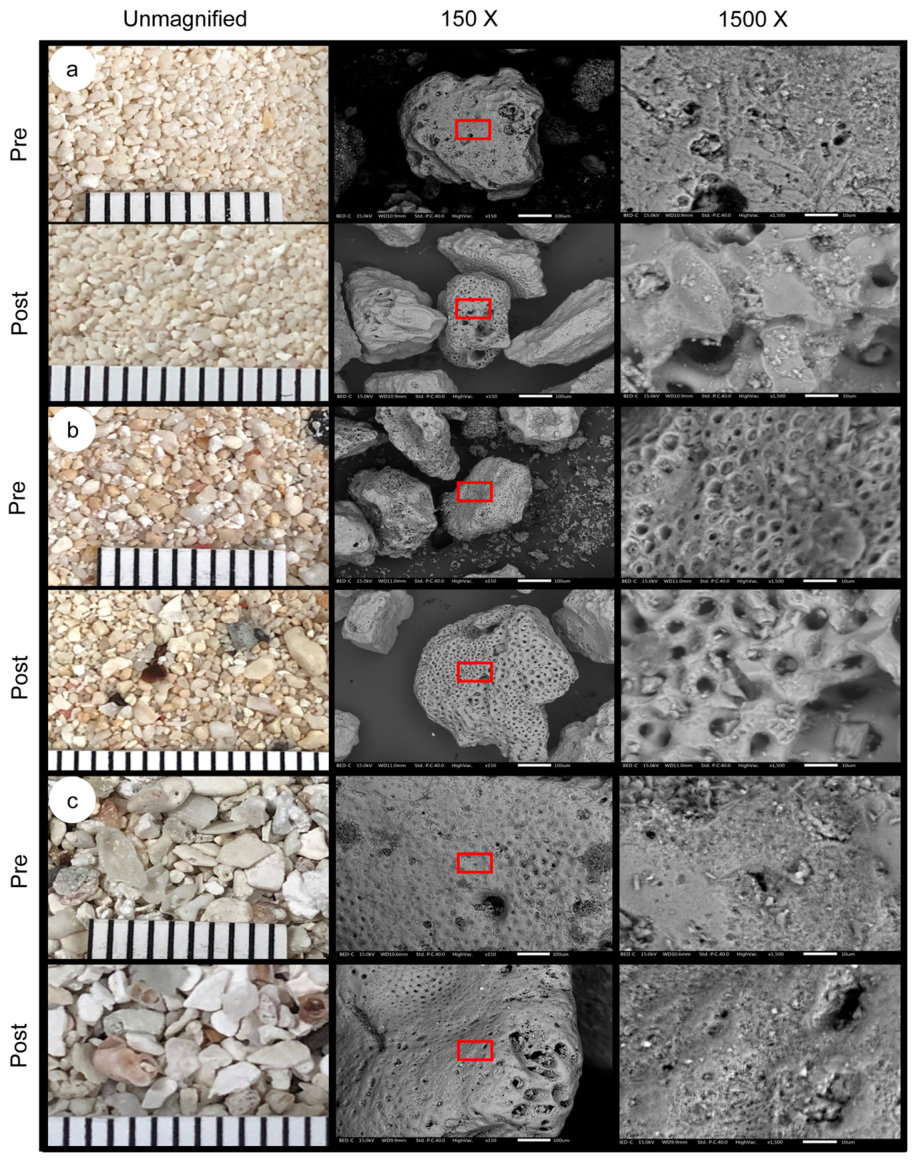
SEM micrograms (example included in Fig. 3) did not reveal obvious differences in surface morphology before and after AELD treatment, nor between sand types which is in-line with findings from Nath et al. (Nath et al., 2011), who concluded that citric acid had no notable morphological effect on limestone, which suggests that coral sands could potentially be regenerated.
SEM显微图像(示例见图3)未显示AELD处理前后以及不同砂类型之间表面形貌存在明显差异,这与Nath等(Nath et al., 2011)的研究结果一致,他们认为柠檬酸对石灰石的形貌无显著影响,这表明珊瑚砂有可能再生利用。
3.1. Sand mini column fluoride removal3.1. 砂微型柱的除氟效果
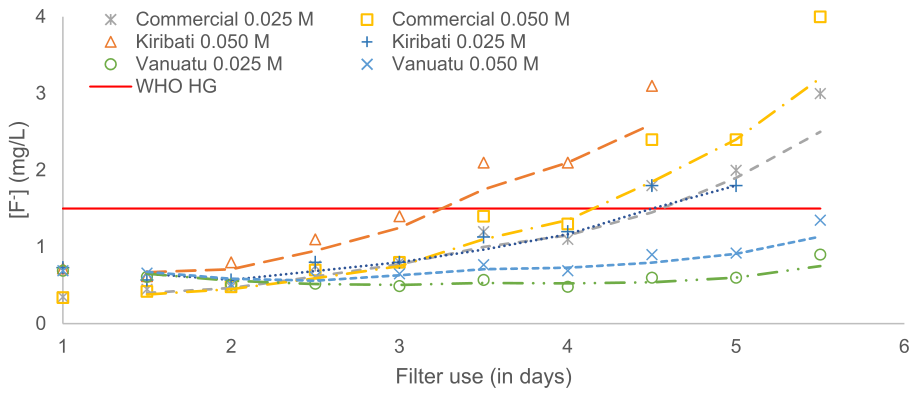
The most likely fluoride removal mechanisms using calcium carbonate and acid are adsorption and precipitation, as previously documented (Nath and Dutta, 2010a; Turner et al., 2005; Nath and Dutta, 2012). Treatment with coral sand mini columns reduced the F-concentration from 10 mg/L to below 1.5 mg/L over a period of 3.5–5 days (Fig. 4). These results are comparable to those of Nath and Dutta (Nath and Dutta, 2010a) who could reuse their reactor for an estimated nine days using 0.1 M citric acid and 12-hour contact.
如前人研究所述,利用碳酸钙和酸除氟最可能的机制为吸附和沉淀(Nath and Dutta, 2010a; Turner et al., 2005; Nath and Dutta, 2012)。珊瑚砂微型柱处理可在3.5–5天内将F-浓度由10 mg/L降至1.5 mg/L以下(图4)。该结果与Nath和Dutta(Nath and Dutta, 2010a)的结果相当,后者在使用0.1 M柠檬酸和12小时接触时间的条件下,反应器估计可重复使用9天。
Overall, the Vanuatu sand performed best, regardless of the citric acid concentration used. Mini columns could be reused for at least five days compared to 3 or 3.5 and 4 days using the Kiribati and finer commercial sand, respectively. This equates to approximately 90–105 mL of acidified water per 75 g of fine grained sands (0.55 and 0.62 mm) and a minimum of 150 mL with larger grained sand (1.33 mm). In essence, 0.01–0.02 mg of F-was removed per g of sand before the treated water exceeded the 1.5 mg/L WHO drinking water guideline. The mineral composition of the sands is unlikely to have contributed to this enhanced F-removal. The commercial sand had the lowest aragonite content of the three sands, ruling out that the enhanced F-removal was due to a higher content of aragonite, which is more soluble than calcite (Stenzel, 1963) (refer Table 1).
总体而言,无论柠檬酸浓度如何,瓦努阿图砂的表现均最佳。其微型柱可重复使用至少5天,而基里巴斯砂和较细市售砂分别为3或3.5天和4天。这相当于每75 g细粒砂(0.55和0.62 mm)可处理约90–105 mL酸化水,而较粗粒砂(1.33 mm)至少可处理150 mL。实质上,在处理后水超过WHO 1.5 mg/L饮用水准则值之前,每g砂可去除0.01–0.02 mg F-。砂的矿物组成不太可能是F-去除效果增强的原因。市售砂的文石含量在三种砂中最低,从而排除了F-去除增强源于溶解度高于方解石的文石含量较高的可能性(Stenzel, 1963)(参见表1)。
3.1.1. Effect of particle size3.1.1. 粒径的影响
There was an inverse relationship between particle size and F- removal. It seems counterintuitive that larger particles (1.33 mm in Vanuatu sand) removed F-better than smaller particles (0.55 and 0.62 mm for fine commercial and Kiribati sands) since larger particles have lower surface area (Mavura et al., 2004). Most authors have reported no appreciable difference or increased F-removal with smaller particles (Nath and Dutta, 2010a; Mondal et al., 2016; Wong and Stenstrom, 2018). Particle size does, however, affect pore volume. It is hypothesised that Vanuatu mini columns could be reused more often because the larger particles resulted in more sand volume and pore space, leaving a lower head-volume of water in the columns. As headwater is not in close contact with the absorbent, it remained effectively untreated and would contain F-at or near the initial concentration of 10.0 mg/L. Finer sand mini columns contained more of this headwater, accounting for the higher F-concentration of the resultant treated water.
粒径与F-去除之间呈负相关关系。由于较大颗粒的比表面积较小(Mavura et al., 2004),较大颗粒(瓦努阿图砂,1.33 mm)对F-的去除效果优于较小颗粒(细粒市售砂和基里巴斯砂,分别为0.55和0.62 mm),这一结果似乎有悖常理。多数学者报道较小颗粒对F-的去除无明显差异或有所增强(Nath and Dutta, 2010a; Mondal et al., 2016; Wong and Stenstrom, 2018)。然而,粒径会影响孔隙体积。我们推测,瓦努阿图砂微型柱之所以可重复使用更多次,是因为较大颗粒使砂体积和孔隙空间更大,从而柱内上部积水体积较小。由于上部积水未与吸附剂紧密接触,实际上未经处理,其F-浓度接近或等于初始浓度10.0 mg/L。细砂微型柱中此类上部积水较多,因而导致所得处理后水的F-浓度较高。
3.1.2. Effect of citric acid concentration on fluoride removal3.1.2. 柠檬酸浓度对除氟效果的影响
Reducing the acid strength from 0.050 M to 0.025 M (or 0.15 N to 0.075 N given citric acid is triprotic) improved F-removal, though not substantially so for all sands as the 2-standard error overlapped (Fig. 4 – error not shown). This contradicts findings from published AELD studies using oxalic, acetic or citric acids, whereby increasing acid concentration enhanced F-removal (Nath and Dutta, 2010b, 2012). These results may be due to the pre-existing F-content of coral sand. Preliminary matrix recovery experiments (refer supplementary data) indicated F- was present in the coral sand naturally, and desorbed into solutions of low or zero F-concentration. In contrast, limestone used by other researchers did not appear to contain appreciable concentrations of F- (Turner et al., 2005; Labastida et al., 2017). The addition of acid to the calcite carbonate sand produced CO2 gas. It was noted that increasing the acid altered the volume of water able to be extracted as well as the sand packing of the mini columns thereby increasing the pore volume and lowering the head volume. This was only noted in hindsight and not specifically quantified throughout the study. The additional extracted volume resided in the head-volume where little to no F-removal could occur, thus an increase in total volume extracted was observed to be related to a higher final F-concentration of treated water.
将酸浓度由0.050 M降至0.025 M(鉴于柠檬酸为三元酸,即由0.15 N降至0.075 N)改善了F-的去除,但由于2倍标准误存在重叠,并非所有砂的改善都十分显著(图4 – 未显示误差)。这与已发表的使用草酸、乙酸或柠檬酸的AELD研究结果相矛盾,这些研究中提高酸浓度可增强F-去除(Nath and Dutta, 2010b, 2012)。这些结果可能源于珊瑚砂中原本存在的F-。初步基质回收试验(参见补充数据)表明,珊瑚砂中天然含有F-,并会解吸进入F-浓度较低或为零的溶液中。相比之下,其他研究者使用的石灰石似乎并不含有可观浓度的F-(Turner et al., 2005; Labastida et al., 2017)。向方解石碳酸盐砂中加酸会产生CO2气体。研究中注意到,提高酸浓度会改变可排出的水量以及微型柱中砂的堆积状态,从而增大孔隙体积并降低上部积水体积。这一点是事后才注意到的,在整个研究中未进行专门定量。额外排出的水量来自几乎无法去除F-的上部积水,因此观察到排出总水量的增加与处理后水最终F-浓度升高相关。
3.2. Fluoride removal in prototype treatment system3.2. 原型处理系统的除氟效果
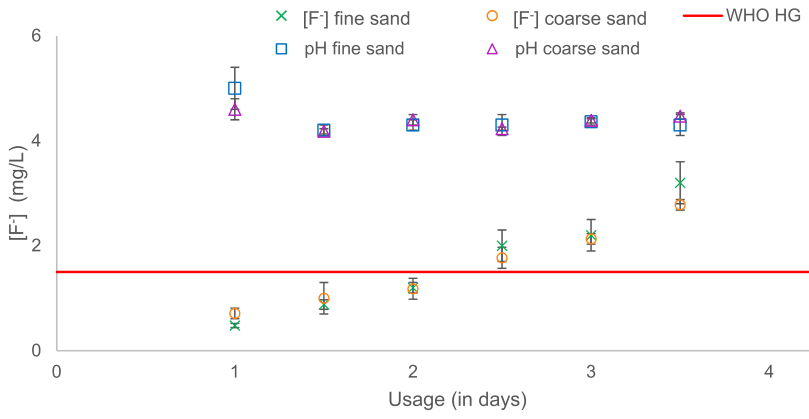
Results from the sand prototype experiment with 0.025 M food grade acid are summarised in Fig. 5. The prototypes containing fine (0.55 mm) coral sand could only reduce F-to below 1.5 mg/L for three uses, which equates to approximately 600 mL of treated water per kg of sand. Unlike with the mini columns, increasing the particle size did not increase F- removal. The particle size increase in prototypes (0.55 mm to 0.90 mm) was not as large as in the mini columns (0.61 mm to 1.32 mm) and may not have been sufficient to create a measurable effect in F-removal. As expected, the pH in fine vs. coarse sand treated water was similar and not an indication of concern. The same batch of analytical grade (AR) acid used in the mini columns was used in a prototype, resulting in only slightly lower final F-concentrations. This prototype could also only be used three times to reduce F-below 1.5 mg/L (data not shown), indicating the difference in performance between mini columns and prototypes is unlikely due to different grade or batch of acid.
使用0.025 M食品级酸的砂原型装置试验结果汇总于图5。装填细粒(0.55 mm)珊瑚砂的原型装置仅能在3次使用中将F-降至1.5 mg/L以下,相当于每kg砂可处理约600 mL水。与微型柱不同,增大粒径并未提高F-的去除。原型装置中粒径的增幅(0.55 mm至0.90 mm)不及微型柱(0.61 mm至1.32 mm),可能不足以对F-去除产生可测的影响。正如预期,细粒砂与粗粒砂处理后水的pH相近,不构成问题。在一个原型装置中使用了与微型柱相同批次的分析纯(AR)酸,最终F-浓度仅略有降低。该原型装置同样仅能使用3次将F-降至1.5 mg/L以下(数据未列出),表明微型柱与原型装置之间的性能差异不太可能源于酸的等级或批次不同。
The prototypes were only able to lower F-below 1.5 mg/L for a maximum of three uses compared with a minimum of seven for the mini columns, regardless of particle size (using the same experimental protocols). The observed difference in removal of F-may be due to the shape of the different treatment systems altering processes such as fluid mechanics, retention, preferential flow, sand compaction, and/or capillary forces. It was observed that, mini columns generally retained slightly more fluid than the prototypes, enabling a longer contact time with the absorbent which would enhance F-removal in subsequent filter uses. Higher efficiency of fluoride removal in columns compared to bucket filters has been previously noted for bone charcoal filters (Fawell et al., 2006). Filter shape appears critical in enhancing F-removal with coral sand, and future design may benefit from two successive filters or more elongated dimensions.
无论粒径如何(采用相同的试验方案),原型装置最多仅能在3次使用中将F-降至1.5 mg/L以下,而微型柱至少可达7次。所观察到的F-去除差异可能是由于不同处理系统的形状改变了流体力学、持水、优先流、砂体压实和/或毛细作用力等过程。观察发现,微型柱通常比原型装置保留略多的液体,使其与吸附剂的接触时间更长,从而在后续过滤使用中增强F-的去除。此前在骨炭过滤器中亦已注意到,柱式过滤器的除氟效率高于桶式过滤器(Fawell et al., 2006)。过滤器形状似乎是增强珊瑚砂去除F-的关键因素,未来的设计可考虑采用两级串联过滤器或更细长的尺寸。
3.3. Comparison of treated water to drinking water guidelines3.3. 处理后水与饮用水准则的比较
Trace element concentrations in water treated with mini sand columns (refer Table 2) exceeded WHO (World Health Organization, 2017)
经砂微型柱处理的水中微量元素浓度(参见表2)超过了WHO(World Health Organization, 2017)
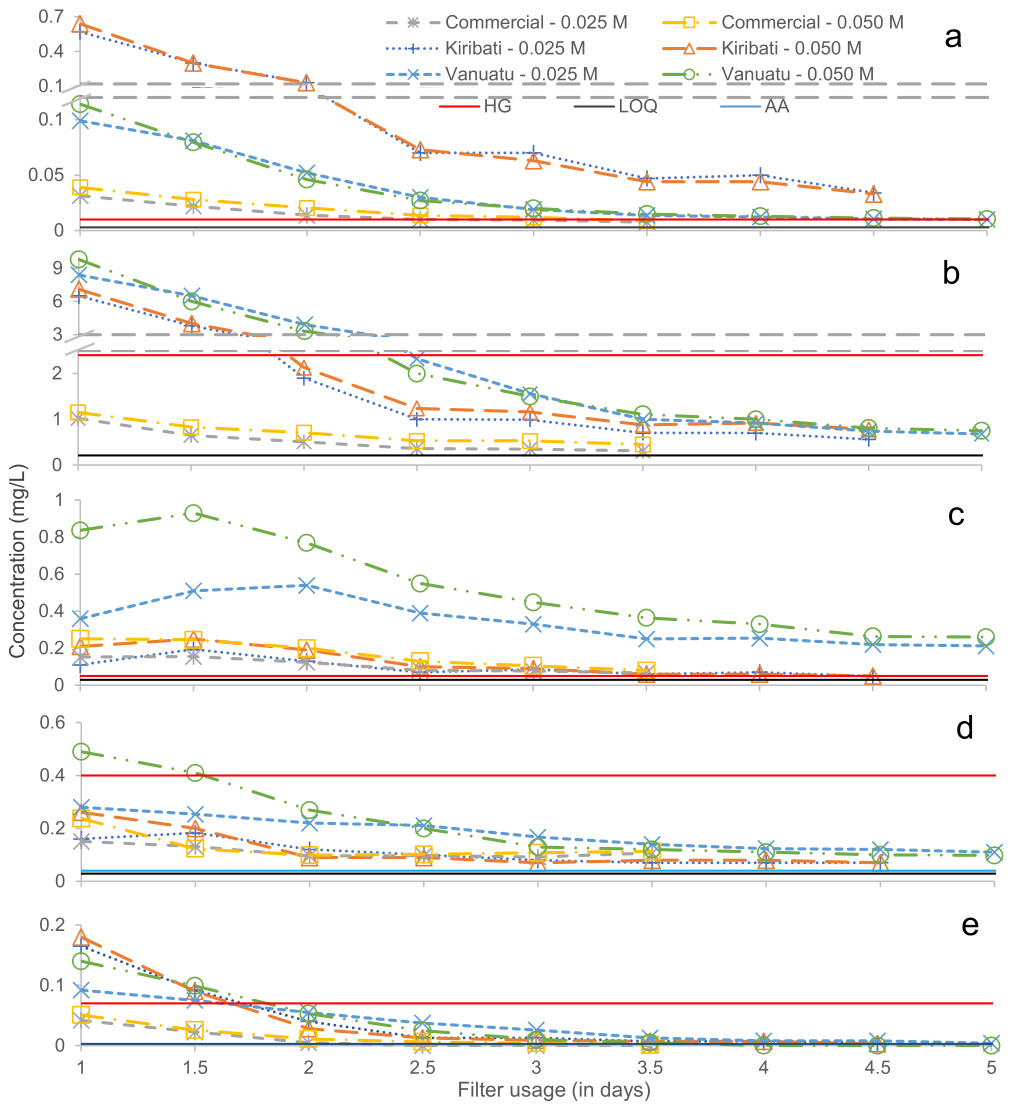
drinking water guidelines for health (As, B, Cr, Mn, Ni) and aesthetic acceptability (Al, Ca, Fe, Mg, Mn, Na and hardness as determined from the concentration of Mg and Ca). Generally, trace element concentrations in the treated water decreased with usage, with the highest concentrations measured during the first 1–3 uses of the mini column (Table 2 and Fig. 6). For most trace elements, higher concentrations were measured in the beach sand-treated water, particularly with sand which had been reused less often, compared with the commercial sand (Fig. 6 and Table 2).
饮用水健康准则值(As、B、Cr、Mn、Ni)和感官可接受性准则值(Al、Ca、Fe、Mg、Mn、Na以及由Mg和Ca浓度计算的硬度)。总体而言,处理后水中的微量元素浓度随使用次数增加而降低,最高浓度出现在微型柱的前1–3次使用中(表2和图6)。对大多数微量元素而言,与市售砂相比,经海滩砂处理的水中测得的浓度更高,尤其是重复使用次数较少的砂(图6和表2)。
The number of consecutive days the treated water exceeded the WHO guidelines varied between trace elements from 1 to 5 days. Chromium concentrations were of most concern, as the WHO health guideline was exceeded for all sand types and over the duration of the up-to 5-day trial. Similarly, As was persistently above guidelines in water treated with the beach sands, particularly so for the Kiribati sand, but only exceeded the guideline in commercial sand for 2–3 days. Nickel exceeded health guidelines for the first day of usage with beach sands only. Manganese was above the health guideline in the water treated with 0.050 M acid and Vanuatu sand on day 1 only, and above aesthetic acceptability for all sands throughout the trial (Fig. 6). Sodium and B were above WHO aesthetic and health guideline, respectively, in beach sand-treated water during the first 2–3 days of usage. Increasing acid concentration, for the most part, increased trace elements released, most likely as a results of sand dissolution (Table 2). The persistent presence of elevated Al and Fe concentrations in all treated water explain the matrix interference issues encountered as both elements are welldocumented electrode interferents, as are B and OH-(American Society for Testing and Materials International, 2016; Baird and Bridgewater, 2017; EDT DirectION, 2021). The presence of Ca above guideline is expected as acid reacts with sand releasing the ion. All treated water samples also exceeded WHO aesthetic acceptability with regards to hardness and total dissolved solids.
处理后水连续超过WHO准则值的天数因微量元素而异,为1至5天。Cr浓度最受关注,因为所有砂类型在长达5天的整个试验期间均超过WHO健康准则值。同样,经海滩砂处理的水中As持续高于准则值,尤以基里巴斯砂为甚,而市售砂仅在2–3天内超过准则值。Ni仅在海滩砂使用的第1天超过健康准则值。Mn仅在第1天于经0.050 M酸和瓦努阿图砂处理的水中高于健康准则值,而在整个试验期间所有砂处理的水中均高于感官可接受性准则值(图6)。在使用的前2–3天,经海滩砂处理的水中Na和B分别高于WHO感官准则值和健康准则值。提高酸浓度在大多数情况下增加了微量元素的释放,这很可能是砂溶解所致(表2)。所有处理后水中持续存在较高浓度的Al和Fe,这解释了所遇到的基质干扰问题,因为这两种元素均为已有充分记载的电极干扰物,B和OH-亦是如此(American Society for Testing and Materials International, 2016; Baird and Bridgewater, 2017; EDT DirectION, 2021)。Ca高于准则值在意料之中,因为酸与砂反应会释放该离子。所有处理后水样在硬度和总溶解性固体方面亦超过了WHO感官可接受性准则值。
Fewer elements of health and aesthetic concern exceeded WHO drinking water guidelines in prototype treated water (Table 3). Aluminium, Ca, Cr, Fe, Mg, and Mn exceeded guidelines for all water samples where F-was lowered from 10 to below 1.5 mg/L (up to 1.5 days or 3 uses) with fine or coarse sand and 0.025 M acid. Though As exceeded health guideline for all tested water samples treated with fine sand and 0.025 M acid, values remained below guideline after day 1 of treatment with coarse sand. Analysis of the initial solutions and ‘no sand’ controls confirmed that the F-and citric acid were not a source of the trace elements. Our findings for trace elements contradict other AELD studies performed with limestone and oxalic or citric acid where trace elements were not of concern (Nath and Dutta, 2010a, 2012).
在原型装置处理的水中,超过WHO饮用水准则值的健康和感官相关元素较少(表3)。在使用细粒或粗粒砂和0.025 M酸将F-由10 mg/L降至1.5 mg/L以下的所有水样中(最长1.5天或3次使用),Al、Ca、Cr、Fe、Mg和Mn均超过准则值。尽管在经细粒砂和0.025 M酸处理的所有测试水样中As均超过健康准则值,但经粗粒砂处理的水在第1天之后As值保持在准则值以下。对初始溶液和“无砂”对照的分析证实,F-和柠檬酸并非微量元素的来源。我们关于微量元素的研究结果与其他以石灰石和草酸或柠檬酸开展的AELD研究相矛盾,后者中微量元素并不构成问题(Nath and Dutta, 2010a, 2012)。
Of those above WHO health guidelines, As is the element of most concern in natural water sources and a documented carcinogen (World
在超过WHO健康准则值的元素中,As是天然水源中最受关注的元素,也是已有记载的致癌物(World
Trace elements above WHO (World Health Organization, 2017) health guideline (HG) and aesthetic acceptability (AA) in treated water following repeated use of mini columns prepared from three sand types with 0.025 or 0.050 M citric acid.
由三种砂类型与0.025或0.050 M柠檬酸制备的微型柱经重复使用后,处理后水中超过WHO(World Health Organization, 2017)健康准则值(HG)和感官可接受性准则值(AA)的微量元素。
| Element元素 | Gu | idelines准则 | Units单位 | LOQ | Commercial i市售 | (fine) Sand(细粒)砂 | Kiriba基里巴斯 | ti Sand砂 | Van | uatu瓦努阿图 |
|---|---|---|---|---|---|---|---|---|---|---|
| HG | AA | 0.025 M | 0.050 M | 0.025 M | 0.050 M | 0.025 M | 0.050 M | |||
| As | 10 | µg/L | 2.9 | Day 1–2 (31) | Day 1–3 (39) | All (570) | All (640) | All (99) | All (110) | |
| B | 2.4 | mg/L | 0.21 | — | — | Day 1–2 (6.5) | Day 1–2 (7.1) | Day 1–3 (8.4) | Day 1–3 (9.8) | |
| Cr | 50 | µg/L | 29 | All (160) | All (250) | All (190*) | All (250) | All (540) | All (930) | |
| Ni | 70 | µg/L | 2.9 | — | — | Day 1 (170) | Day 1 (180) | Day 1 (92) | Day 1 (140) | |
| Al | 0.1–0.2 | mg/L | 0.29 | All (2.4) | All (2.4) | All (1.3) | All (1.3) | All (2.5) | All (3.2) | |
| Ca | 100–500 | mg/L | 21 | All (1400) | All (1600) | All (1500*) | All (2200) | All (1300) | All (2400) | |
| Fe | 0.3 | mg/L | 0.21 | All (1.9) | All (2.3) | All (6.2*) | All (6.7) | All (2.5) | All (3.4) | |
| Mg | 100–500 | mg/L | 21 | All (140) | All (210) | All (670) | All (730) | All (780) | All (830) | |
| Mn | 400 | 100 | µg/L | 29 | All (150) | All (240) | All (180*) | All (260) | All (280) | All(490) |
| Na | 200 | mg/L | 2.1 | — | — | Day 1–2 (3300) | Day 1–2 (3000) | Day 1–3 (7800) | Day 1–3 (7000) | |
| Hardness | 100–500 | mg/L | 42 | All (1500) | All (1800) | All (1800) | All (3000) | All (2000) | All (3100) |
Number of days where treated water samples were above limit is listed (mini columns used twice daily with an initial solution of 10 mg F-/L). All = all sampled tested (where [F-]/L was below 1.5 mg/L). Bracketed number is highest average value (n=2, *n=1) with control deducted. **Mn above WHO HG on day 1, and above AA for remainder of experiment. Hardness calculated from [Ca] + [Mg]. LOQ = Limit of Quantitation
表中列出处理后水样高于限值的天数(微型柱每日使用两次,初始溶液为10 mg F-/L)。All = 所有检测样品([F-]/L低于1.5 mg/L者)。括号内数字为扣除对照后的最高平均值(n=2,*n=1)。**Mn在第1天高于WHO HG,在试验其余时间高于AA。硬度由[Ca] + [Mg]计算。LOQ = 定量限
Trace elements above WHO (World Health Organization, 2017) health guideline (HG) and aesthetic acceptability (AA) in sand treated water following repeated use of prototypes (fine or coarse commercial sand) with 0.025 M citric acid.
原型装置(细粒或粗粒市售砂)与0.025 M柠檬酸经重复使用后,砂处理水中超过WHO(World Health Organization, 2017)健康准则值(HG)和感官可接受性准则值(AA)的微量元素。
| Element元素 | Gu | idelines准则 | Units单位 | LOQ | Fi | ne Sand细粒砂 | Coarse粗粒 | Sand砂粒 |
|---|---|---|---|---|---|---|---|---|
| HG | AA | 0 M | 0.025 M | 0 M | 0.025 M | |||
| As | 10 | µg/L | 2.1 | — | All (23) | — | Day 1 (12) | |
| Cr | 50 | µg/L | 2.1 | — | All (128) | Use 1 (85) | All (130) | |
| Al | 100–200 | µg/L | 210 | — | All (1700) | Day 1 (1300) | All (1700) | |
| Ca | 100–500 | mg/L | 212 | — | All (1600) | — | All (1700) | |
| Fe | 300 | µg/L | 21 | — | All (1300) | Use 1 (900) | All (1200) | |
| Mg | 100–500 | mg/L | 2.1 | — | All (110) | — | All (120) | |
| Mn | 400 | 100 | µg/L | 21 | — | All (120) | — | All (100) |
| Hardness | 100–500 | mg/L | 215 | — | All (4500) | — | All (5000) | |
| TDS | 1 | g/L | — | All (1.5) | — | All (1.5) |
Initial solution of 10 mg F-/L treated with 5:1 sand-fluid ratio prototypes, used twice daily. Number of days above limit is listed. All = all sampled tested which included up to Day 2, use 1. Number in brackets is highest average value measured (n=3, n=1 for 0 M), with control deducted. Hardness calculated from [Ca] + [Mg]. TDS = total dissolved solids. LOQ = Limit of Quantitation.
初始溶液为10 mg F-/L,采用砂液比为5:1的原型装置处理,每日使用两次。表中列出高于限值的天数。All = 所有检测样品,包括至第2天第1次使用的样品。括号内数字为扣除对照后测得的最高平均值(n=3,0 M为n=1)。硬度由[Ca] + [Mg]计算。TDS = 总溶解性固体。LOQ = 定量限。
Health Organization, 2017). Consumption of As-contaminated waters has been associated with various health issues including: peripheral vascular disease and neuropathy; skin lesions; bladder, lung, and skin cancers; problematic child and foetal developmental (World Health Organization, 2017; Vahter et al., 2020), to name a few. Though Cr (III)
Health Organization, 2017)。饮用受As污染的水与多种健康问题相关,包括:外周血管疾病和神经病变;皮肤病变;膀胱癌、肺癌和皮肤癌;儿童和胎儿发育问题(World Health Organization, 2017; Vahter et al., 2020)等。尽管Cr (III)
is an essential element with no apparent adverse long-term effects through oral consumption (World Health Organization, 2020), Cr (VI) is carcinogenic (World Health Organization, 2020; Georgaki et al., 2023) and has been associated with various human respiratory, immune, reproductive, digestive and GI dysfunctions (Georgaki and
是一种必需元素,经口摄入未见明显的长期不良影响(World Health Organization, 2020),但Cr (VI)具有致癌性(World Health Organization, 2020; Georgaki et al., 2023),并与人体呼吸、免疫、生殖、消化和胃肠道等多种功能障碍相关(Georgaki and
Trace element concentrations in the sands used to make the mini columns and prototype treatment devices.
用于制作微型柱和原型处理装置的砂中微量元素浓度。
| Element元素 | Elemental C元素 | omposition (in mg/kg)组成(mg/kg) | LOQ | SRM % | ||
|---|---|---|---|---|---|---|
| Vanuatu | Kiribati | Commercial (fine) | Commercial (coarse) | Recovery | ||
| Al | 800±1300 | 60± 20 | 150±10 | 100±20 | 3.5 | 88 |
| As | 2.5± 0.7 | 3± 1 | 1.6± 0.2 | 1.9±0.2 | 0.35 | 77 |
| B | 50±8 | 76±8 | 71±9 | 58±6 | 3.5 | n/a |
| Cd | _<_LOQ | 0.084± 0.008 | _<_LOQ | 0.05±0.01 | 0.035 | 93 |
| Co | 0.1± 0.1 | 0.2± 0.4 | 0.044± 0.008 | _<_LOQ | 0.035 | 87 |
| Cr | 8± 5 | 3± 3 | 2.1± 0.3 | 2.3±0.4 | 0.035 | 80 |
| Cu | 0.67± 0.07 | 3± 5 | 0.21± 0.07 | 0.14±0.01 | 0.035 | 87 |
| Fe | 200± 300 | 6000±12000 | 120±80 | 30±10 | 0.35 | 68 |
| Mn | 10±4 | 30± 30 | 9± 2 | 11±4 | 3.5 | 96 |
| Ni | 0.4± 0.2 | 1± 2 | 0.38± 0.04 | 0.29±0.04 | 0.035 | 84 |
| Pb | 1.9± 0.3 | 40±110 | 0.4± 0.07 | 0.4± 0.06 | 0.035 | 85 |
| Zn | 1.3± 0.9 | 7.2±2. | 1.4± 0.4 | 1.5±0.4 | 0.35 | 120 |
| Elemental | Composition (in g/kg) | |||||
| Ca | 340±20 | 330±40 | 330±40 | 330±20 | 0.035 | 73 |
| Mg | 14±4 | 17±2 | 6.3± 0.6 | 9±4 | 0.0035 | 88 |
| Na | 4.4± 0.5 | 4.3± 0.2 | 3.4± 0.1 | 3.1±0.2 | 0.00035 | 72 |
| S | 1.6± 0.3 | 1.7± 0.3 | 1.4± 0.1 | 1.4±0.3 | 0.035 | 62 |
Average ± 2 SD (n=3) with average of two blanks deducted. LOQ = Limit of Quantitation; SRM = Standard Reference Material (National Institute of Standards and Technology, 2019).
平均值 ± 2 SD(n=3),已扣除两个空白的平均值。LOQ = 定量限;SRM = 标准参考物质(National Institute of Standards and Technology, 2019)。
Charalambous, 2023; Pellerin and Booker, 2000).
Charalambous, 2023; Pellerin and Booker, 2000)。
3.4. Trace elements in coral sands3.4. 珊瑚砂中的微量元素
Analysis of the sand for trace elements confirmed the presence of electrode interferents (Al, B, and Fe) and elements of health and aesthetic concern (notably Al, As, Cr, Fe, Mn, and Ni) (Table 4). The most likely source of these trace elements is the geographical origins of the sands. Arsenic is prevalent in regions with volcanic and hydrothermal activity (Bundschuh et al., 2010; Masuda, 2018). Additionally, Ambae (Vanuatu) lava contains a notable amount of Cr (500–1600 mg/kg), Mn (1100–1200 mg/kg), and Ni (100 – 600 mg/kg) (Park et al., 2012). This presence of trace elements has implications for the use of coral sand in drinking water treatment. Firstly, additional treatment would be required to reduce trace elements from treated water to acceptable concentrations. Potential options for remediation of elevated As and Cr could include sorption on bioadsorbents, activated carbon, metal oxide coated on sands, zero-valent iron (Chowdhury, 2012; Cornejo et al., 2008; Garcia Ferreira et al., 2023; Rahidul Hassan, 2023; Chen et al., 2018), to name a few. Activated carbon could potentially resolve any aesthetic issues as well (Chowdhury, 2012). Pre-treating the sand to flush out trace contaminants present prior to defluoridation is a potential alternative. Secondly, water quality monitoring following coral sand treatment is advisable and could be as simple as employing commercially available test strips for arsenic (camlab.co. uk; coleparmer.com) and drinking water test kits (amazon.com; alibaba. com).
对砂中微量元素的分析证实了电极干扰物(Al、B和Fe)以及健康和感官相关元素(尤其是Al、As、Cr、Fe、Mn和Ni)的存在(表4)。这些微量元素最可能的来源是砂的地理来源。As在火山和热液活动地区普遍存在(Bundschuh et al., 2010; Masuda, 2018)。此外,Ambae(瓦努阿图)熔岩含有相当数量的Cr(500–1600 mg/kg)、Mn(1100–1200 mg/kg)和Ni(100 – 600 mg/kg)(Park et al., 2012)。微量元素的存在对珊瑚砂在饮用水处理中的应用具有重要影响。首先,需要额外处理才能将处理后水中的微量元素降至可接受浓度。修复As和Cr偏高的可行方案包括利用生物吸附剂、活性炭、金属氧化物包覆砂、零价铁等进行吸附(Chowdhury, 2012; Cornejo et al., 2008; Garcia Ferreira et al., 2023; Rahidul Hassan, 2023; Chen et al., 2018)。活性炭还可能解决感官方面的问题(Chowdhury, 2012)。另一种可行的替代方案是在除氟前对砂进行预处理,冲洗出其中存在的微量污染物。其次,建议在珊瑚砂处理后开展水质监测,方法可以很简单,如使用市售的砷检测试纸(camlab.co. uk; coleparmer.com)和饮用水检测试剂盒(amazon.com; alibaba. com)。
3.5. Cost-effectiveness, defluoridation capacity and reuse of the limestone3.5. 成本效益、除氟容量与石灰石的重复利用
The proposed method is low-cost and hence potentially suitable in resource constrained settings. As sand may be collected from coral beaches and no power is required for treatment, the ongoing cost of fluoride removal is governed by the local price of citric acid. Using 0.025 M acid (4.8 g/L), and assuming an inflated purchased price of 5 $/kg, treatment costs less than 0.025 $/L. This estimate does not factor in pre- or posttreatment to remedy elevated trace contaminants.
所提出的方法成本低廉,因此可能适用于资源匮乏的环境。由于砂可从珊瑚海滩采集,且处理过程无需电力,除氟的持续成本取决于当地柠檬酸价格。使用0.025 M酸(4.8 g/L),并假设较高的采购价格为5 $/kg,处理成本低于0.025 $/L。该估算未计入为修复微量污染物偏高而进行的前处理或后处理。
Though not undertaken in this study, regeneration of the coral sands could be attempted with scrubbing or soaking in alkaline solution (El Messaoudi et al., 2024; Gogoi et al., 2015; Nath and Dutta, 2010a). Care would need to be taken with regeneration of sands as it could further mobilise trace elements. Given ease of access, replacement as opposed to regeneration of sand may be simpler. The environmental impact of returning the F-saturated coral sand into the sea would be negligeable given the high geogenic levels of F-in the tropical region and the excessive volume of sea water.
尽管本研究未开展相关试验,但可尝试通过擦洗或碱性溶液浸泡使珊瑚砂再生(El Messaoudi et al., 2024; Gogoi et al., 2015; Nath and Dutta, 2010a)。砂的再生需谨慎进行,因为这可能进一步活化微量元素。鉴于砂易于获取,更换砂而非再生可能更为简便。鉴于热带地区F-的地质成因背景值较高且海水体量巨大,将F-饱和的珊瑚砂返还海洋所造成的环境影响可忽略不计。
The operational defluoridation capacity of the coral sands using 0.025 M citric acid, to decreased F-concentration from 10 mg/L to below 1.5 mg/L in mini columns of fine and coarse sands was estimated to be 1.4 L/kg and >2 L/kg respectively, whereas the prototypes capacity was limited to 0.6 L/kg of sand, regardless of particle size. This equates to 0.011–0.020 mg/g in mini columns vs. 0.007 mg/g in prototypes. Various treatments applied to adsorbents (e.g. thermal, chemical coating) (Gogoi and Dutta, 2016b; Lee et al., 2021; Chang et al., 2019; He et al., 2020) have significantly enhanced their adsorption capacity and could be explored with coral sands.
使用0.025 M柠檬酸时,在细粒砂和粗粒砂微型柱中将F-浓度由10 mg/L降至1.5 mg/L以下的珊瑚砂运行除氟容量估计分别为1.4 L/kg和>2 L/kg,而原型装置的容量无论粒径如何均仅为0.6 L/kg砂。这相当于微型柱为0.011–0.020 mg/g,原型装置为0.007 mg/g。对吸附剂采用的各种处理(如热处理、化学包覆)(Gogoi and Dutta, 2016b; Lee et al., 2021; Chang et al., 2019; He et al., 2020)显著提高了其吸附容量,可在珊瑚砂上加以探索。
4Conclusions结论
AELD treatment with coral sands reduced 10 mg/L fluoride solution to below the WHO 1.5 mg/L limit for drinking water, with mini columns more successful than 1 L polyethylene prototypes. In mini columns, approximately 100 mL of acidified water could be treated with 75 g of fine grained sands (0.55 and 0.62 mm) and a minimum of 150 mL could be treated with larger grained sand (1.33 mm). One kg of fine sand (0.55 and 0.90 mm) in 1 L prototype devices could only successfully reduce fluoride below 1.5 mg/L in approximately 600 mL of acidified water. Key findings of this study are that a ‘goldilocks’ range of particle size exists and filter shape are significant factors in optimizing F-removal. Determining this range and optimising filter design should be the focus of future research. Due to the presence of trace elements in the sands, trace element concentrations in the treated water exceeded WHO drinking water guidelines for human health (As, B, Cr, Ni, Mn) and aesthetic acceptability (Al, Ca, Fe, Mg, Mn, Na). Further work is required to include a second treatment stage to remove trace elements from water or remove trace metal contaminants from coral sand prior to use as a water filtering medium.
采用珊瑚砂的AELD处理可将10 mg/L的氟化物溶液降至WHO饮用水限值1.5 mg/L以下,其中微型柱的效果优于1 L聚乙烯原型装置。在微型柱中,75 g细粒砂(0.55和0.62 mm)约可处理100 mL酸化水,而较粗粒砂(1.33 mm)至少可处理150 mL。在1 L原型装置中,1 kg细粒砂(0.55和0.90 mm)仅能将约600 mL酸化水中的氟化物成功降至1.5 mg/L以下。本研究的主要发现是:存在一个“恰到好处”的粒径范围,且过滤器形状是优化F-去除的重要因素。确定该粒径范围并优化过滤器设计应成为未来研究的重点。由于砂中含有微量元素,处理后水中的微量元素浓度超过了WHO饮用水的人体健康准则值(As、B、Cr、Ni、Mn)和感官可接受性准则值(Al、Ca、Fe、Mg、Mn、Na)。今后需进一步开展工作,增设第二级处理以去除水中的微量元素,或在将珊瑚砂用作滤水介质之前去除其中的微量金属污染物。
CRediT authorship contribution statementCRediT作者贡献声明
MH Lecompte: Writing – original draft, Visualization, Project administration, Investigation, Funding acquisition, Formal analysis. B. Robinson: Writing – review & editing, Supervision, Methodology. S. Gaw: Writing – review & editing, Supervision, Resources, Methodology,
MH Lecompte:撰写 – 初稿、可视化、项目管理、调查研究、经费获取、正式分析。B. Robinson:撰写 – 审阅与编辑、指导、方法学。S. Gaw:撰写 – 审阅与编辑、指导、资源、方法学、
Funding acquisition, Conceptualization.经费获取、概念构思。
Declaration of Competing Interest利益冲突声明
The authors declare that they have no known competing financial interests or personal relationships that could have appeared to influence the work reported in this paper.
作者声明,不存在任何可能影响本文所报道工作的已知经济利益冲突或个人关系。
Data availability数据可用性
The data that has been used in this manuscript is available in the corresponding author’s Master’s thesis, available from the UC (University of Canterbury) Research Repository.
本文所用数据可见于通讯作者的硕士学位论文,该论文可从坎特伯雷大学(UC)研究资源库获取。
Acknowledgement致谢
The authors thank University of Canterbury staff and students for technical assistance (Dr M. Polson, Dr N. Alexander, C. Grimshaw, R. Stainthorpe, N. Oliver and H. Thompson-Morrison); colleagues at ESR for procurement of coral sand and/or constructive feedback (M. Ashworth, Dr L. Weaver, Dr J. Gregor, Dr L. Burbery, B. Humphries). This work was supported by a scholarship from the Waterways Centre for Freshwater Management, University of Canterbury.
作者感谢坎特伯雷大学的工作人员和学生提供的技术协助(Dr M. Polson、Dr N. Alexander、C. Grimshaw、R. Stainthorpe、N. Oliver和H. Thompson-Morrison);感谢ESR的同事采购珊瑚砂和/或提供建设性意见(M. Ashworth、Dr L. Weaver、Dr J. Gregor、Dr L. Burbery、B. Humphries)。本研究由坎特伯雷大学Waterways Centre for Freshwater Management奖学金资助。
Appendix A. Supporting information附录A 补充材料
Supplementary data associated with this article can be found in the online version at doi:10.1016/j.clwat.2024.100025.
与本文相关的补充数据可在线获取,doi:10.1016/j.clwat.2024.100025。
References参考文献
Alarcon-Herrera, M.T., Bundschuh, J., Nath, B., Nicolli, H.B., Gutierrez, M., Reyes- ´ Gomez, V.M., Nunez, D., Martín-Dominguez, I.R., Sracek, O., 2013. Co-occurrence of ˜ arsenic and fluoride in groundwater of semi-arid regions in Latin America: Genesis, mobility and remediation. J. Hazard. Mater. 262, 960–969. https://doi.org/ 10.1016/j.jhazmat.2012.08.005.
Allibone, R., Cronin, S.J., Charley, D.T., Neall, V.E., Stewart, R.B., Oppenheimer, C., 2012. Dental fluorosis linked to degassing of Ambrym volcano, Vanuatu: A novel exposure pathway. Environ. Geochem. Health 34, 155–170. https://doi.org/ 10.1007/s10653-010-9338-2.
American Society for Testing and Materials International, Standard Test Methods for Fluoride Ion in Water, (2016). ASTM. D1179-16.
Ayoob, S., Gupta, A.K., 2006. Fluoride in drinking water: A review on the status and stress effects. Crit. Rev. Environ. Sci. Technol. 36, 433–487. https://doi.org/ 10.1080/10643380600678112.
Baird, R., Bridgewater, L. (Eds.), 2017. Standard Methods for the Examination of Water
and Wastewater, 23rd edition. American Public Health Association, Washington, D.
C.
Bundschuh, J., Litter, M., Ciminelli, V.S.T., Morgada, M.E., Cornejo, L., Hoyos, S.G., Hoinkis, J., Alarcon-Herrera, Ma.T., Armienta, M.A., Bhattacharya, P., 2010. ´ Emerging mitigation needs and sustainable options for solving the arsenic problems of rural and isolated urban areas in Latin America – A critical analysis. Water Res 44, 5828–5845. https://doi.org/10.1016/j.watres.2010.04.001.
Burbery, L., Weaver, L., Humphries, B., Gregor, J., 2015. Efficacy of coral sand for removal of Escherichia coli and bacteriophage under saturated flow conditions. J. Environ. Qual. 44, 1384–1391. https://doi.org/10.2134/jeq2015.01.0044.
Chang, H.Y.H., Kuo, Y.-L., Liu, J.C., 2019. Fluoride at waste oyster shell surfaces – Role of magnesium. Sci. Total Environ. 652, 1331–1338. https://doi.org/10.1016/j. scitotenv.2018.10.238.
Chen, Y., An, D., Sun, S., Gao, J., Qian, L., 2018. Reduction and removal of chromium VI in water by powdered activated carbon. Materials 11, 269. https://doi.org/10.3390/ ma11020269. Cherukumilli, K., Maurer, T., Hohman, J.N., Mehta, Y., Gadgil, A.J., 2018. Effective remediation of groundwater fluoride with inexpensively processed Indian bauxite. Environ. Sci. Technol. 52, 4711–4718. https://doi.org/10.1021/acs.est.7b05539.
Chowdhury, Z., 2012. Activated Carbon: Solutions for Improving Water Quality, Illustrated edition. American Water Works Assn, Denver.
Cordeiro, S., Coutinho, R., Cruz, J.V., 2012. Fluoride content in drinking water supply in S˜ao Miguel volcanic island (Azores, Portugal). Sci. Total Environ. 432, 23–36. https://doi.org/10.1016/j.scitotenv.2012.05.070.
Cornejo, L., Lienqueo, H., Arenas, M., Acarapi, J., Contreras, D., Y´anez, J., Mansilla, H.D., ˜ 2008. In field arsenic removal from natural water by zero-valent iron assisted by solar radiation. Environ. Pollut. 156, 827–831. https://doi.org/10.1016/j. envpol.2008.05.022.
volcano, New Zealand. J. Volcanol. Geotherm. Res. 121, 271–291. https://doi.org/ 10.1016/S0377-0273(02)00465-1.
D’Alessandro, W., 2006. Human fluorosis related to volcanic activity: A review. In: Environ. Toxicol. WIT Press, Mykonos, Greece, pp. 21–30. https://doi.org/10.2495/ ETOX060031. EDT DirectION, Combination ISE range. EDT DirectION electrochemistry products, n.d. https://www.edt.co.uk/Fluoride-Combination-Ion-Selective-Electrode (accessed June 6, 2021).
EDT DirectION, Fluoride ISE – 3221 [Instruction Manual]. EDT DirectION electrochemistry products, n.d. https://www.edt.co.uk/Fluoride-Combination-Ion- Selective-Electrode (accessed June 6, 2021). Fan, X., 2003. Adsorption kinetics of fluoride on low cost materials. Water Res 37, 4929–4937. https://doi.org/10.1016/j.watres.2003.08.014.
Fawell, J., Bailey, K., Chilton, J., Dahi, E., Fewtrell, L., Magara, Y., 2006. Fluoride in Drinking-Water. World Health Organization. 〈https://iris.who.int/handle/1066 5/43514〉.
Garcia Ferreira Jr, J.E., Maia, L.C., dos Santos, G.R., Soares, L.C., Gurgel, L.V.A., 2023. An affordable bioadsorbent system to treat arsenic-contaminated drinking water in the developing world: Prototyping and economic assessment. J. Environ. Chem. Eng. 11, 111199 https://doi.org/10.1016/j.jece.2023.111199. Georgaki, M.-N., Charalambous, M., Kazakis, N., Talias, M.A., Georgakis, C., Papamitsou, T., Mytiglaki, C., 2023. Chromium in water and carcinogenic human health risk. Environments 10, 33. https://doi.org/10.3390/environments10020033. Georgaki, M.-N., Charalambous, M., 2023. Toxic chromium in water and the effects on the human body: a systematic review. J. Water Health 21, 205–223. https://doi.org/ 10.2166/wh.2022.214. Gogoi, S., Nath, S.K., Bordoloi, S., Dutta, R.K., 2015. Fluoride removal from groundwater by limestone treatment in presence of phosphoric acid. J. Environ. Manag. 152, 132–139. https://doi.org/10.1016/j.jenvman.2015.01.031.
Gogoi, S., Dutta, R.K., 2016a. Mechanism of fluoride removal by phosphoric acid-enhanced limestone: equilibrium and kinetics of fluoride sorption. Desalin. Water Treat. https://doi.org/10.1080/19443994.2015.1010592. Gogoi, S., Dutta, R.K., 2016b. Fluoride removal by hydrothermally modified limestone powder using phosphoric acid. J. Environ. Chem. Eng. 4, 1040–1049. https://doi. org/10.1016/j.jece.2016.01.004.
HACH, Conductivity and total dissolved solids, n.d. https://www.hach.com/asset-get. download.jsa?id=10929896653 (accessed June 6, 2021).
He, J., Yang, Y., Wu, Z., Xie, C., Zhang, K., Kong, L., Liu, J., 2020. Review of fluoride removal from water environment by adsorption. J. Environ. Chem. Eng. 8, 104516 https://doi.org/10.1016/j.jece.2020.104516.
B.L. Humphries, L. Weaver, L.F. Burbery, J. Gregor, Coral beach sand as engineered sand filter in septic tank effluent drainage fields in Kiribati, in: Rotorua, 2016.
International Organization for Standardization, Water Quality - Determination of Fluoride - Part 1: Electrochemical Probe Method for Potable and Lightly Polluted Water, (1992). ISO. 10359-1:1992(E).
Kanaujia, S., Singh, B., Singh, S.K., 2015. Removal of fluoride from groundwater by pcarbonised Punica granatum carbon (“CPGC”) bio-adsorbent. J. Geosci. Environ. Prot. 03, 1–9. https://doi.org/10.4236/gep.2015.34001. Keesari, T., Sinha, U.K., Kamaraj, P., Sharma, D.A., 2019. Groundwater quality in a semi-arid region of India: Suitability for drinking, agriculture and fluoride exposure risk. J. Earth Syst. Sci. 128, 24. https://doi.org/10.1007/s12040-018-1049-6.
Kimambo, V., Bhattacharya, P., Mtalo, F., Mtamba, J., Ahmad, A., 2019. Fluoride occurrence in groundwater systems at global scale and status of defluoridation – State of the art. Groundw. Sustain. Dev. 9, 100223 https://doi.org/10.1016/j. gsd.2019.100223.
Labastida, I., Armienta, M.A., Beltran, M., Caballero, G., Romero, P., Rosales, M.A., 2017. ´ Limestone as a sustainable remediation option for water contaminated with fluoride. J. Geochem. Explor. 183, 206–213. https://doi.org/10.1016/j.gexplo.2016.12.001. Lee, J.-I., Kang, J.-K., Hong, S.-H., Lee, C.-G., Jeong, S., Park, S.-J., 2021. Thermally treated Mytilus coruscus shells for fluoride removal and their adsorption mechanism. Chemosphere 263, 128328. https://doi.org/10.1016/j.chemosphere.2020.128328.
Levy, S., 2005. Total fluoride intake higher in subjects of low socioeconomic status. J. Evid. Based Dent. Pract. 5, 209–210. https://doi.org/10.1016/j. jebdp.2005.09.014.
Mallik, T.K., 1999. Calcareous sands from a coral atoll-should it be mined or not? Mar. Georesources Geotechnol. 17, 27–32. https://doi.org/10.1080/106411999273981.
Masuda, H., 2018. Arsenic cycling in the Earth’s crust and hydrosphere: Interaction between naturally occurring arsenic and human activities. Prog. Earth Planet. Sci. 5, 68. https://doi.org/10.1186/s40645-018-0224-3.
Mavura, W.J., Mwanyika, F.T., Wrensford, G., 2004. Construction and optimisation of a cartridge filter for removing fluoride in drinking water. Bull. Chem. Soc. Ethiop. 18 https://doi.org/10.4314/bcse.v18i1.61630.
Meenakshi, Maheshwari, R.C., 2006. Fluoride in drinking water and its removal. J. Hazard. Mater. 137, 456–463. https://doi.org/10.1016/j.jhazmat.2006.02.024.
El Messaoudi, N., Franco, D.S.P., Gubernat, S., Georgin, J., S¸enol, Z.M., Cigero˘glu, Z., ˘ Allouss, D., El Hajam, M., 2024. Advances and future perspectives of water defluoridation by adsorption technology: A review. Environ. Res. 252, 118857 https://doi.org/10.1016/j.envres.2024.118857.
Mohapatra, M., Anand, S., Mishra, B.K., Giles, D.E., Singh, P., 2009. Review of fluoride removal from drinking water. J. Environ. Manag. 91, 67–77. https://doi.org/ 10.1016/j.jenvman.2009.08.015.
Mondal, N.K., Bhaumik, R., Datta, J.K., 2016. Fluoride adsorption by calcium carbonate, activated alumina and activated sugarcane ash. Environ. Process. 3, 195–216. https://doi.org/10.1007/s40710-016-0130-x.
Cronin, S.J., Neall, V.E., Lecointre, J.A., Hedley, M.J., Loganathan, P., 2003. Environmental hazards of fluoride in volcanic ash: a case study from Ruapehu
Nath, S.K., Bordoloi, S., Dutta, R.K., 2011. Effect of acid on morphology of calcite during acid enhanced defluoridation. J. Fluor. Chem. 132, 19–26. https://doi.org/10.1016/ j.jfluchem.2010.10.007. Nath, S.K., Dutta, R.K., 2010a. Enhancement of limestone defluoridation of water by acetic and citric acids in fixed bed reactor. CLEAN – Soil Air Water 38, 614–622. https://doi.org/10.1002/clen.200900209.
Nath, S.K., Dutta, R.K., 2010b. Fluoride removal from water using crushed limestone. Indian J. Chem. Technol. 17, 120–125.
Nath, S.K., Dutta, R.K., 2012. Acid-enhanced limestone defluoridation in column reactor using oxalic acid. Process Saf. Environ. Prot. 90, 65–75. https://doi.org/10.1016/j. psep.2011.07.001. National Institute of Standards and Technology, 2019. Certificate of Analysis - Standard Reference Material 2702 - Inorganics in Marine Sediment. NIST. SRM 2702. https:// www-s.nist.gov/m-srmors/certificates/2702.pdf. National Institute of Standards and Technology, 2015. Certificate of Analysis - Trace Elements in Water. NIST. SRM 1643f:2015. https://www-s.nist.gov/m-srmors/view_ certPDF.cfm?certificate=1643f.
Park, J.-W., Campbell, I.H., Eggins, S.M., 2012. Enrichment of Rh, Ru, Ir and Os in Cr spinels from oxidized magmas: Evidence from the Ambae volcano, Vanuatu. Geochim. Cosmochim. Acta 78, 28–50. https://doi.org/10.1016/j.gca.2011.11.018. Pellerin, C., Booker, S.M., 2000. Reflections of hexavalent chromium: health hazards of an industrial heavyweight. Environ. Health Perspect. 108, A402–A407. https://doi. org/10.1289/ehp.108-a402.
Rahidul Hassan, H.A., 2023. A review on different arsenic removal techniques used for decontamination of drinking water. Environ. Pollut. Bioavailab. 35 https://doi.org/ 10.1080/26395940.2023.2165964. Reardon, E.J., Wang, Y., 2000. A limestone reactor for fluoride removal from wastewaters. Environ. Sci. Technol. 34, 3247–3253. https://doi.org/10.1021/ es990542k.
Rubio, C., Rodríguez, I., Jaudenes, J.R., Guti´errez, A.J., Paz, S., Burgos, A., Hardisson, A., Revert, C., 2020. Fluoride levels in supply water from a volcanic area in the Macaronesia region. Environ. Sci. Pollut. Res. 27, 11587–11595. https://doi.org/ 10.1007/s11356-020-07702-x.
Sarkar, D., Haldar, A., 2005. Physical and Chemical Methods in Soil Analysis: Fundamental Concepts of Analytical Chemistry and Instrumental Techniques. New Age International, New Delhi. 〈http://site.ebrary.com/id/10318667〉.
Saxena, N., 2018. A review on fluoride in ground water: Causes, effects and solutions. Int
J. Eng. Res Appl. 8, 21–24.
Stenzel, H.B., 1963. Aragonite and calcite as constituents of adult oyster shells. Science 142, 232–233. https://doi.org/10.1126/science.142.3589.232.
Taylor, M., Elliott, H.A., Navitsky, L.O., 2018. Relationship between total dissolved solids and electrical conductivity in Marcellus hydraulic fracturing fluids. Water Sci. Technol. 77, 1998–2004. https://doi.org/10.2166/wst.2018.092.
Thermo Fisher Scientific, BD Plastipak(TM) plastic concentric luer-lock syringe, 2020. https://www.fishersci.co.uk/shop/products/plastipak-plastic-concentric-luer-locksyringe/10636531 (accessed May 6, 2020).
Turner, B.D., Binning, P., Stipp, S.L.S., 2005. Fluoride removal by calcite: Evidence for fluorite precipitation and surface adsorption. Environ. Sci. Technol. 39, 9561–9568. https://doi.org/10.1021/es0505090.
United States Environmental Protection Agency, Microwave Assisted Acid Digestion of Sediments, Sludges, and Oils, (2007). U.S. EPA Method 3051A (SW-846).
Vahter, M., Skroder, H., Rahman, S.M., Levi, M., Derakhshani Hamadani, J., Kippler, M., ¨ 2020. Prenatal and childhood arsenic exposure through drinking water and food and cognitive abilities at 10 years of age: A prospective cohort study. Environ. Int. 139, 105723 https://doi.org/10.1016/j.envint.2020.105723.
Vijayeeswarri, J., Geethapriyai, M., Ramamurthy, V., 2019. Community level defluoridation of groundwater with limestone derived adsorbent. Process Saf. Environ. Prot. 127, 9–15. https://doi.org/10.1016/j.psep.2019.04.029.
Vinati, A., Mahanty, B., Behera, S.K., 2015. Clay and clay minerals for fluoride removal from water: A state-of-the-art review. Appl. Clay Sci. 114, 340–348. https://doi.org/ 10.1016/j.clay.2015.06.013.
Wang, Y., Reardon, E.J., 2001. Activation and regeneration of a soil sorbent for defluoridation of drinking water. Appl. Geochem. 16, 531–539. https://doi.org/ 10.1016/S0883-2927(00)00050-0.
Wentworth, C.K., 1922. A scale of grade and class terms for clastic sediments. J. Geol. 30, 377–392. 〈https://www.jstor.org/stable/30063207〉.
Wong, E.Y., Stenstrom, M.K., 2018. Onsite defluoridation system for drinking water treatment using calcium carbonate. J. Environ. Manag. 216, 270–274. https://doi. org/10.1016/j.jenvman.2017.06.060.
World Health Organization., 2004. Fluoride in Drinking-Water. World Health Organization, Geneva (https://www.who.int/docs/default-source/wash-
documents/wash-chemicals/fluoride-background-document.pdf). World Health Organization, 2017. Guidelines for Drinking-Water Quality, 4th ed + 1st add. World Health Organization, Geneva https://iris.who.int/handle/10665/ 254637.
World Health Organization, Chromium in Drinking-Water, Geneva, 2020. https://iris. who.int/bitstream/handle/10665/338062/WHO-HEP-ECH-WSH-2020.3-eng.pdf.
Yadav, K.K., Gupta, N., Kumar, V., Khan, S.A., Kumar, A., 2018. A review of emerging adsorbents and current demand for defluoridation of water: Bright future in water sustainability. Environ. Int. 111, 80–108. https://doi.org/10.1016/j.
envint.2017.11.014.
Yang, M., Hashimoto, T., Hoshi, N., Myoga, H., 1999. Fluoride removal in a fixed bed packed with granular calcite. Water Res. 33, 3395–3402. https://doi.org/10.1016/ S0043-1354(99)00052-4.